See follow-up articles:
🤗 The ethblock.art BlockStyle 'Pattern 03' was released on August 28th, 2021 and sold out in only 2 hours with 888 pieces.
Pattern 03 is a tribute to fountain pen plotting, generating strokes lines to yield unique patterns. It recreates the condition of ink on paper in a digital art form. The second market will be exciting as these are also physically plottable. A SVG file can be downloaded from each NFT that is the recipe for a physical artist to perform the art physically (20cm square), with their own tools.
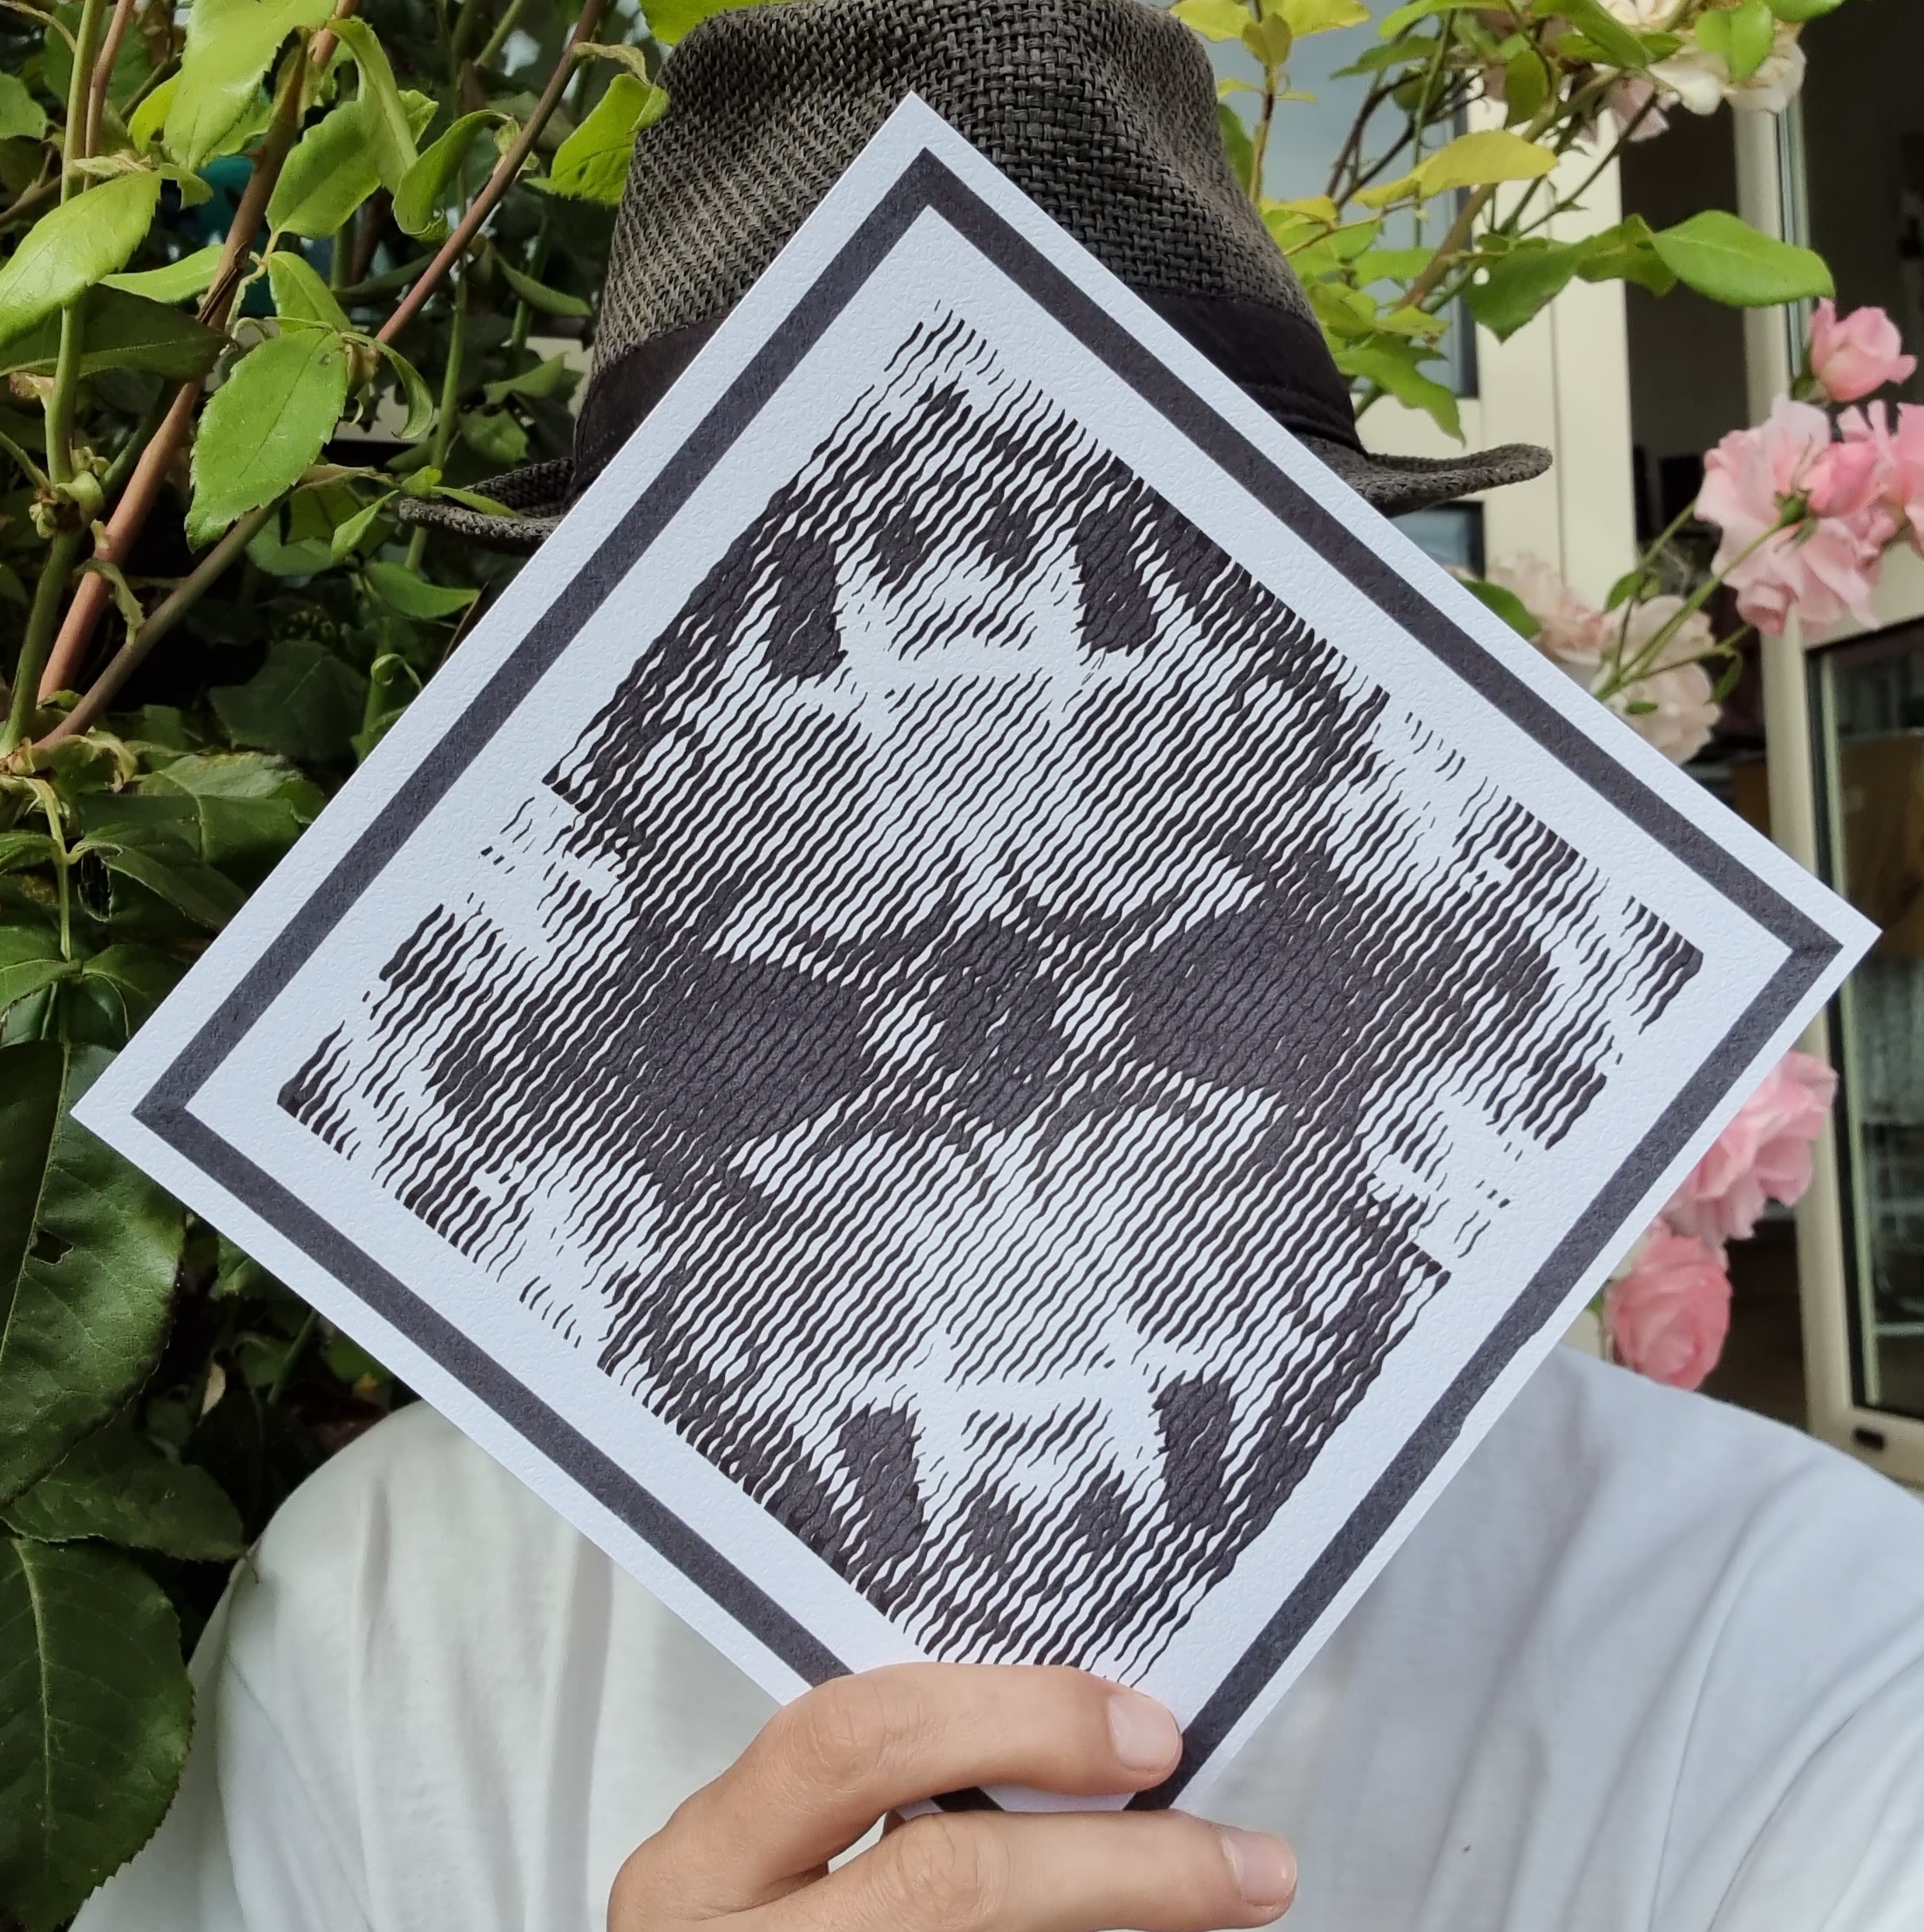
This article goes through many features of the generator and includes plotting tricks, technical notes, and useful information for collectors. You will see images attached, both digital and physical prototypes, at the end the rendering is very similar!
For many months, I've been exploring plotting art with fountain pens while exploring many different creative coding techniques. Every day, I've been releasing generators and plotting art that you can find on https://greweb.me/plots. This has been very interesting both technically and artistically. I expanded more and more my algorithm knowledge and creative coding techniques. These various experiences now contribute to this next level: I've made a "super generator" that generalizes many of them into one bundled ethblock.art BlockStyle generator.
Pattern 03 took a lot of patience and iterations to achieve its final result. I put my own expectation pretty high, I wanted great variety (and tweaking parameters is always hard). I also wanted a very realistic rendering technique that would almost look like the physical piece. The digital version had to be as good, if not better, than the possible physical piece that it could produce. I believe a lot in digital NFT by itself and the goal is to embrace digital-first.
In the past months, I've been thinking a lot about NFTs and the possibilities of physical VS digital art. I see many artists bridging the two worlds as well, there are many great experiments out there, I collected a bunch of physical art myself via NFTs. You already saw me already trying this "plot loops" concept.
By minting on the generator, you are generating digital art.
A lot of effort has been spent on the digital piece itself. It renders in a very realistic way on your browser, almost like if it was plotted, simulating many aspects of plotting. There is even a slight animation that I let you discover! The digital art is a unique 1:1 piece that will be an NFT that includes the SVG recipe:
By minting on the generator, you are curating one recipe for a possible plot.
I've been plotting many prototypes to tweak parameters in a way that everything should technically be drawn with fountain pens! By minting, you are curating a plottable art that an artist from the plotting community could use. I've intentionally made it public and open for anyone to download the SVG related to a mint piece: ultimately anyone can plot it. This only unlocks the possibility and I will personally be one of this "physical artist" for the coming weeks. (see NFT and physical pieces? section for more information)
By minting on the generator, you are a curator of the future plot collection.
Giving the possibility for curators to select plotted art out of a generator with fine controls to tweak it is beyond anything I've seen done today in this field. In fine, minters have the responsibility to chose something really interesting that worth plotting, to express this responsibility, the fees to mint has been a bit higher than my previous BlockStyle.
What I now want to achieve is to make the NFT as good "digitally" as it can be "physically". I've been plotting many prototypes to tweak parameters in a way that everything should technically be drawn with fountain pens! I want this art to be both physical and digital and in a loosely coupled way that gives full freedom of preferring one or the other or both.
I intend later to offer a way for collectors to obtain the physical creation from me, but I believe this idea is beyond me and anyone in the plotting community could pick these to plot them. I believe a lot in free art, opensource and hacking mindset. I enjoy a lot free initiative like plotterfiles.com and this was a great inspiration here.
What is EthBlock.art?
Before talking about 'Pattern 03', a quick recap of the platform I'm releasing on:
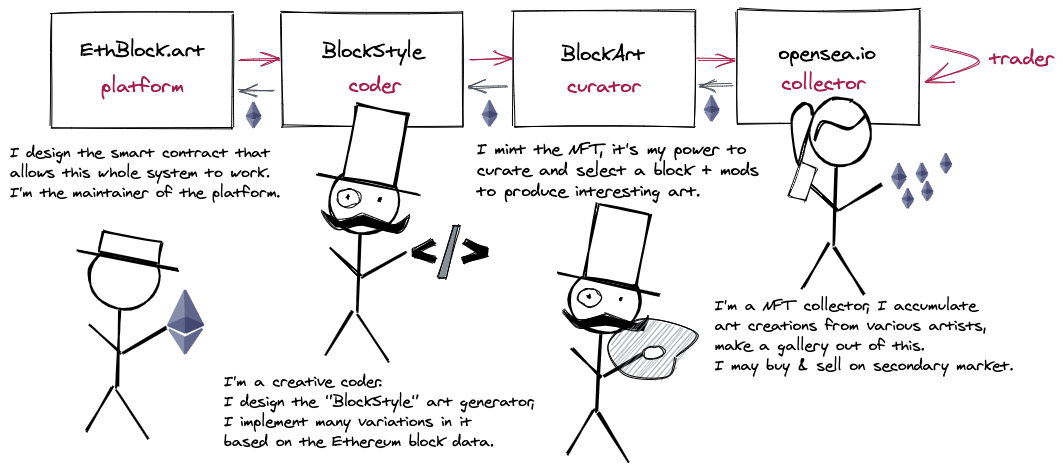
EthBlock.art aims to create a virtuous ecosystem of "deterministic art", code visualization of Ethereum blocks. Everything is data: from the ethereum block of transactions, to the code that visualizes it, and to the NFTs minted/traded using Ethereum transactions (that themselves are into Ethereum blocks).
This is a virtuous ecosystem, similar to Supply Chain Transformation concepts: each actor in this ecosystem add value and get retributed for it, as I tried to explain in this schema:
The controls
As a minter, you get 6 "mods" controls.
MOD1: allows you to pick your color. which recreates the conditions of some inks. Black is very powerful but also other inks are very vivid.
MOD2: is controlling two factors, the border width (0.5 to 1.0) and the intensity of the noise (cycles twice).
MOD3: is a general padding control and also tweaks border placement and sometimes lines distance.
MOD4: control the alignment of waves and the amplitude of the "displacement" effect.
MOD5: controls the resolution of each line. (beware high values slows down other mods)
MOD6: adds a variable blur effect.
MOD2 to MOD5 are controlling at least two properties of the art. This is something I like to call the "duality of controls". When you make one slider controlling two properties, you are giving a lot of variety while "constraining" the boundaries of the possible tweaks, forcing the minter to look for other blocks. This also is very important for the UX of the controls. There is always a tradeoff between being fully in control and having to search another block.
Rarity features, block data and what drives the generation
In JavaScript is implemented the logic to extract out the "parameters" of the generator from the block data. While some of the work relies on the block hash and use an RNG (fun fact: there are 70 calls to random() to make it very diverse in results and rarity), some of the work also are big data analysis on the block data.
I'm going to document here how some of the main features work, You can do a general Ethereum blocks analysis to find the shape you prefer!
There are some other rarity features that I intentionally do not fully document. You do not need to "hunt" for the rarity that is "designed by the author", but instead search for the organic rarity & enjoy patterns and unexpected shapes.
I crawled a lot of data from coingecko and etherscan to snapshot the prices of all ERC20 tokens in a way that I can value exactly how much a block have in $. I can then compare the Ethereum value and the ERC20 tokens value and do decisions based on it. (evaluated with Aug 2021 static prices)
Main shapes
This most important feature split is the main shapes:
- If there is at least one transaction and mostly only Ethereum is transferred on that block (which is the case for very old blocks btw), you're going to get a "rectangle spiral".
- If more $ is transferred in ETH than in ERC20 tokens, it's going to be vertical lines, horizontal otherwise.
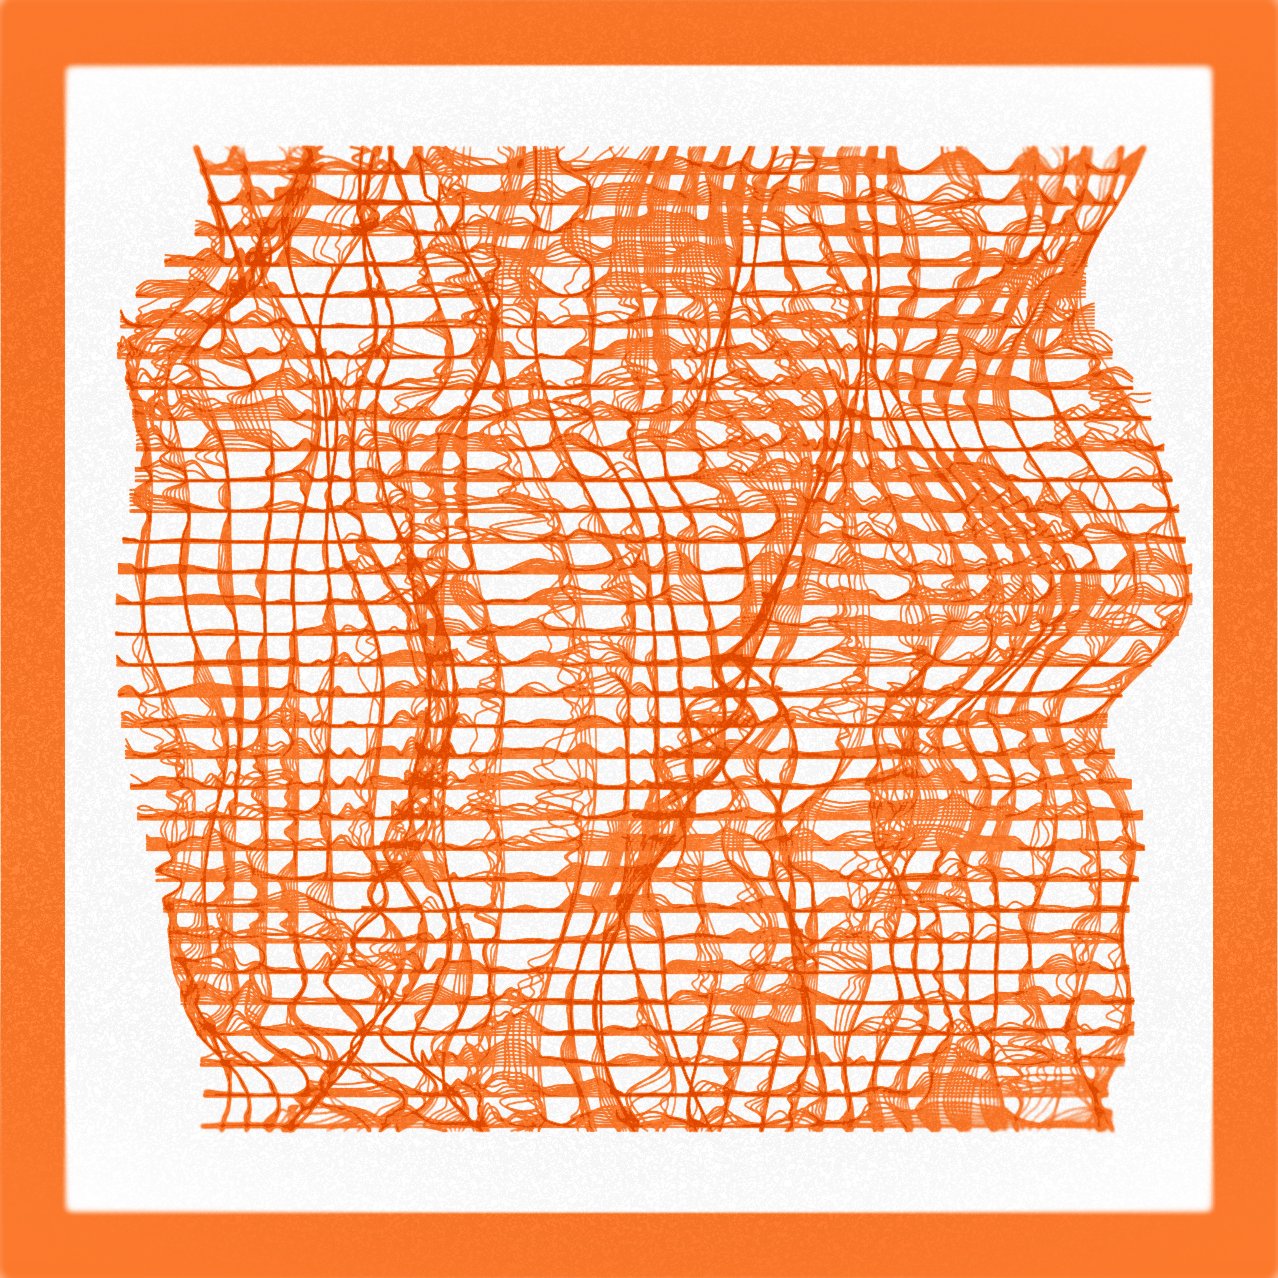
- And finally, if there are actually exceptional amounts of ERC20 transfers (mostly only ERC20 transfers) it's going to Cross-Hatch.
lines and "sub-lines"
First: The plots are all composed of N main lines.
The number of lines are driven by the number of transactions. More there are transactions in the minted art, more likely the number of lines will be high. This goes between 1 and 90 and these extremes are rare.
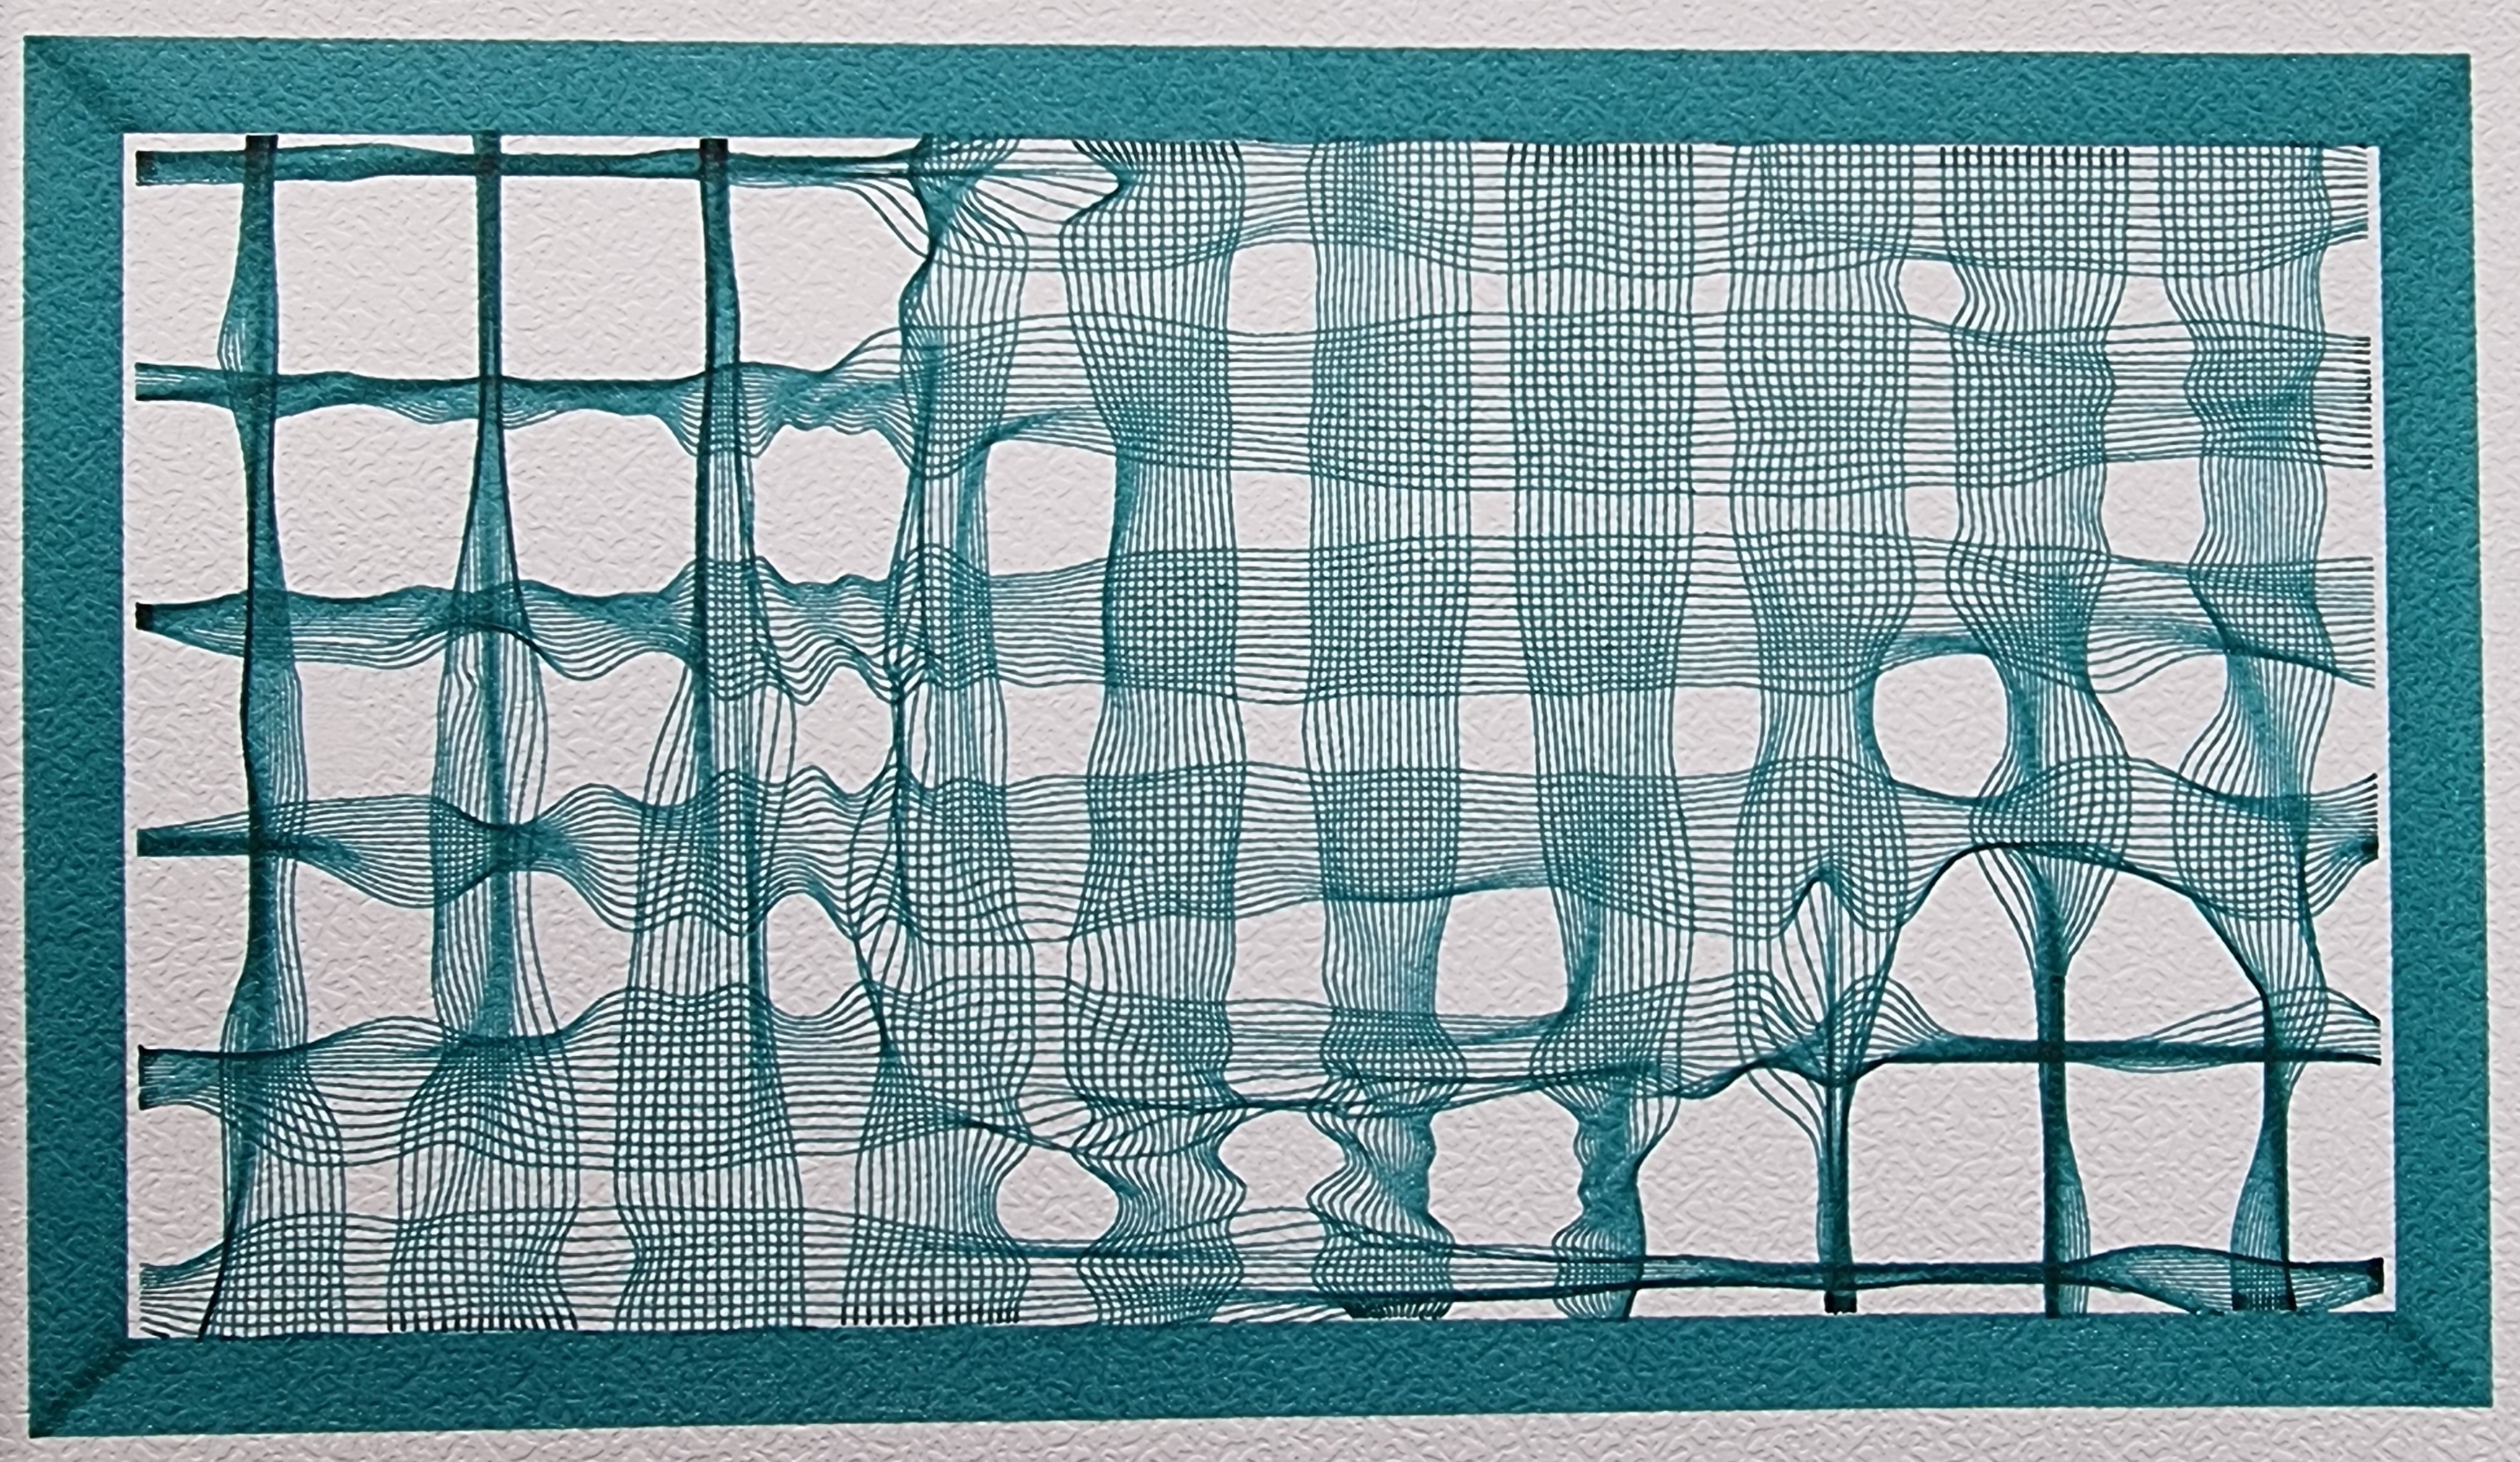
Second: each line subdivide into M "sub-lines".
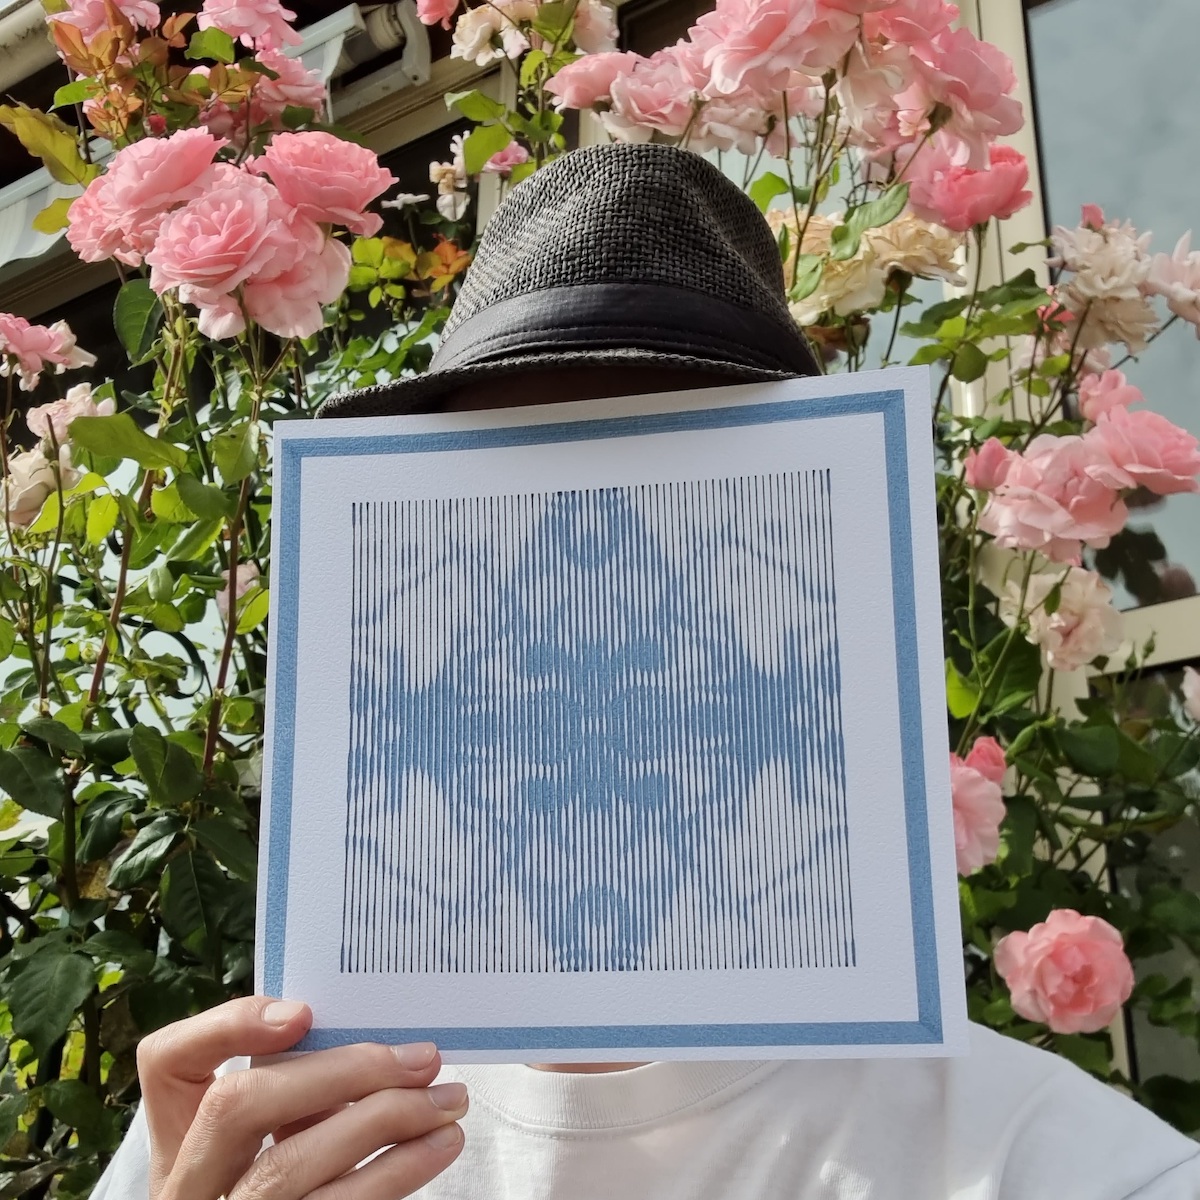
It is most visible when there are not a lot of "lines" as it will diverge so much that sublines are no longer touching:
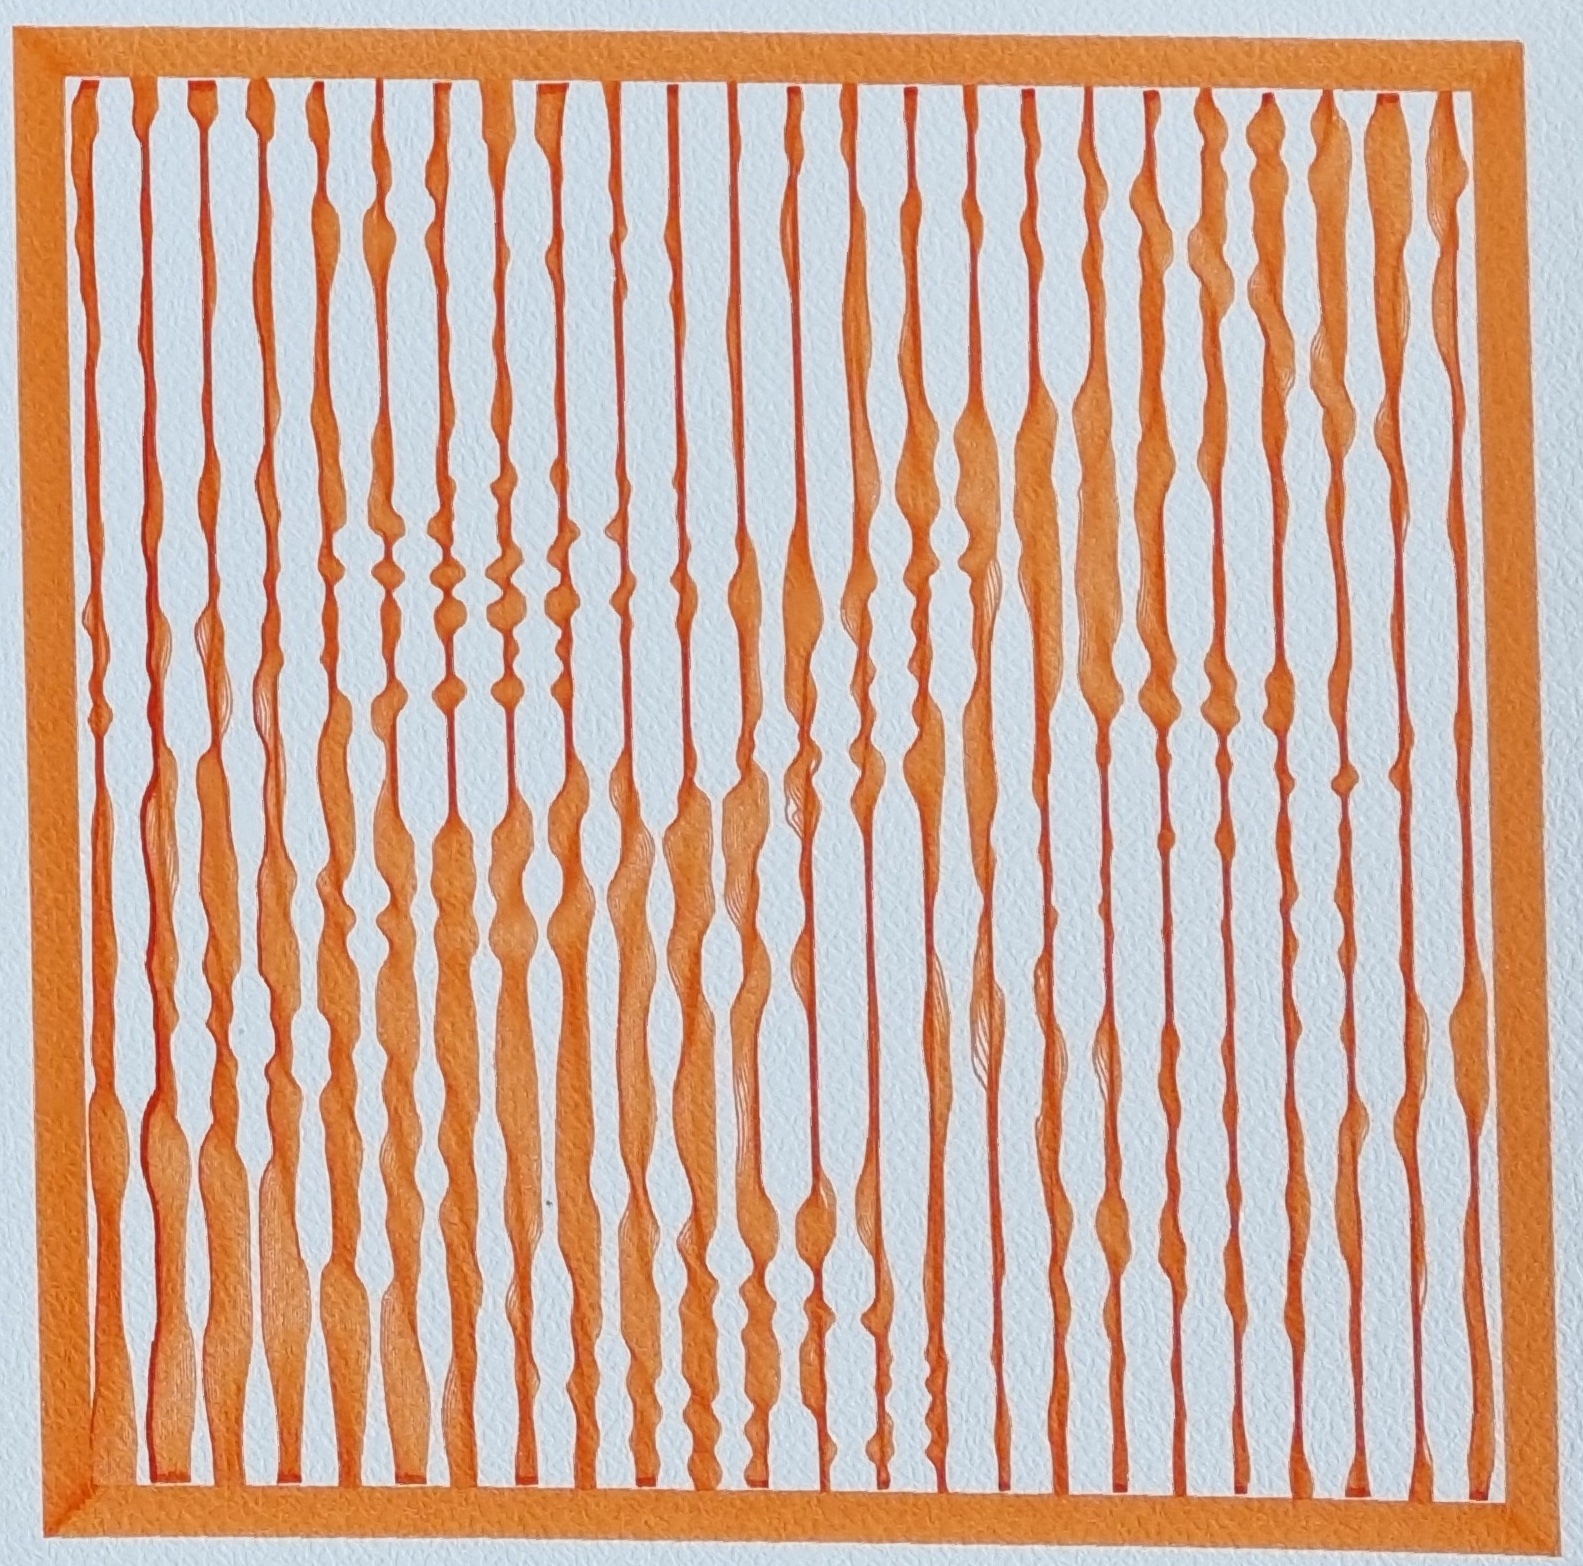
but it can also be subtle and not separate at all:
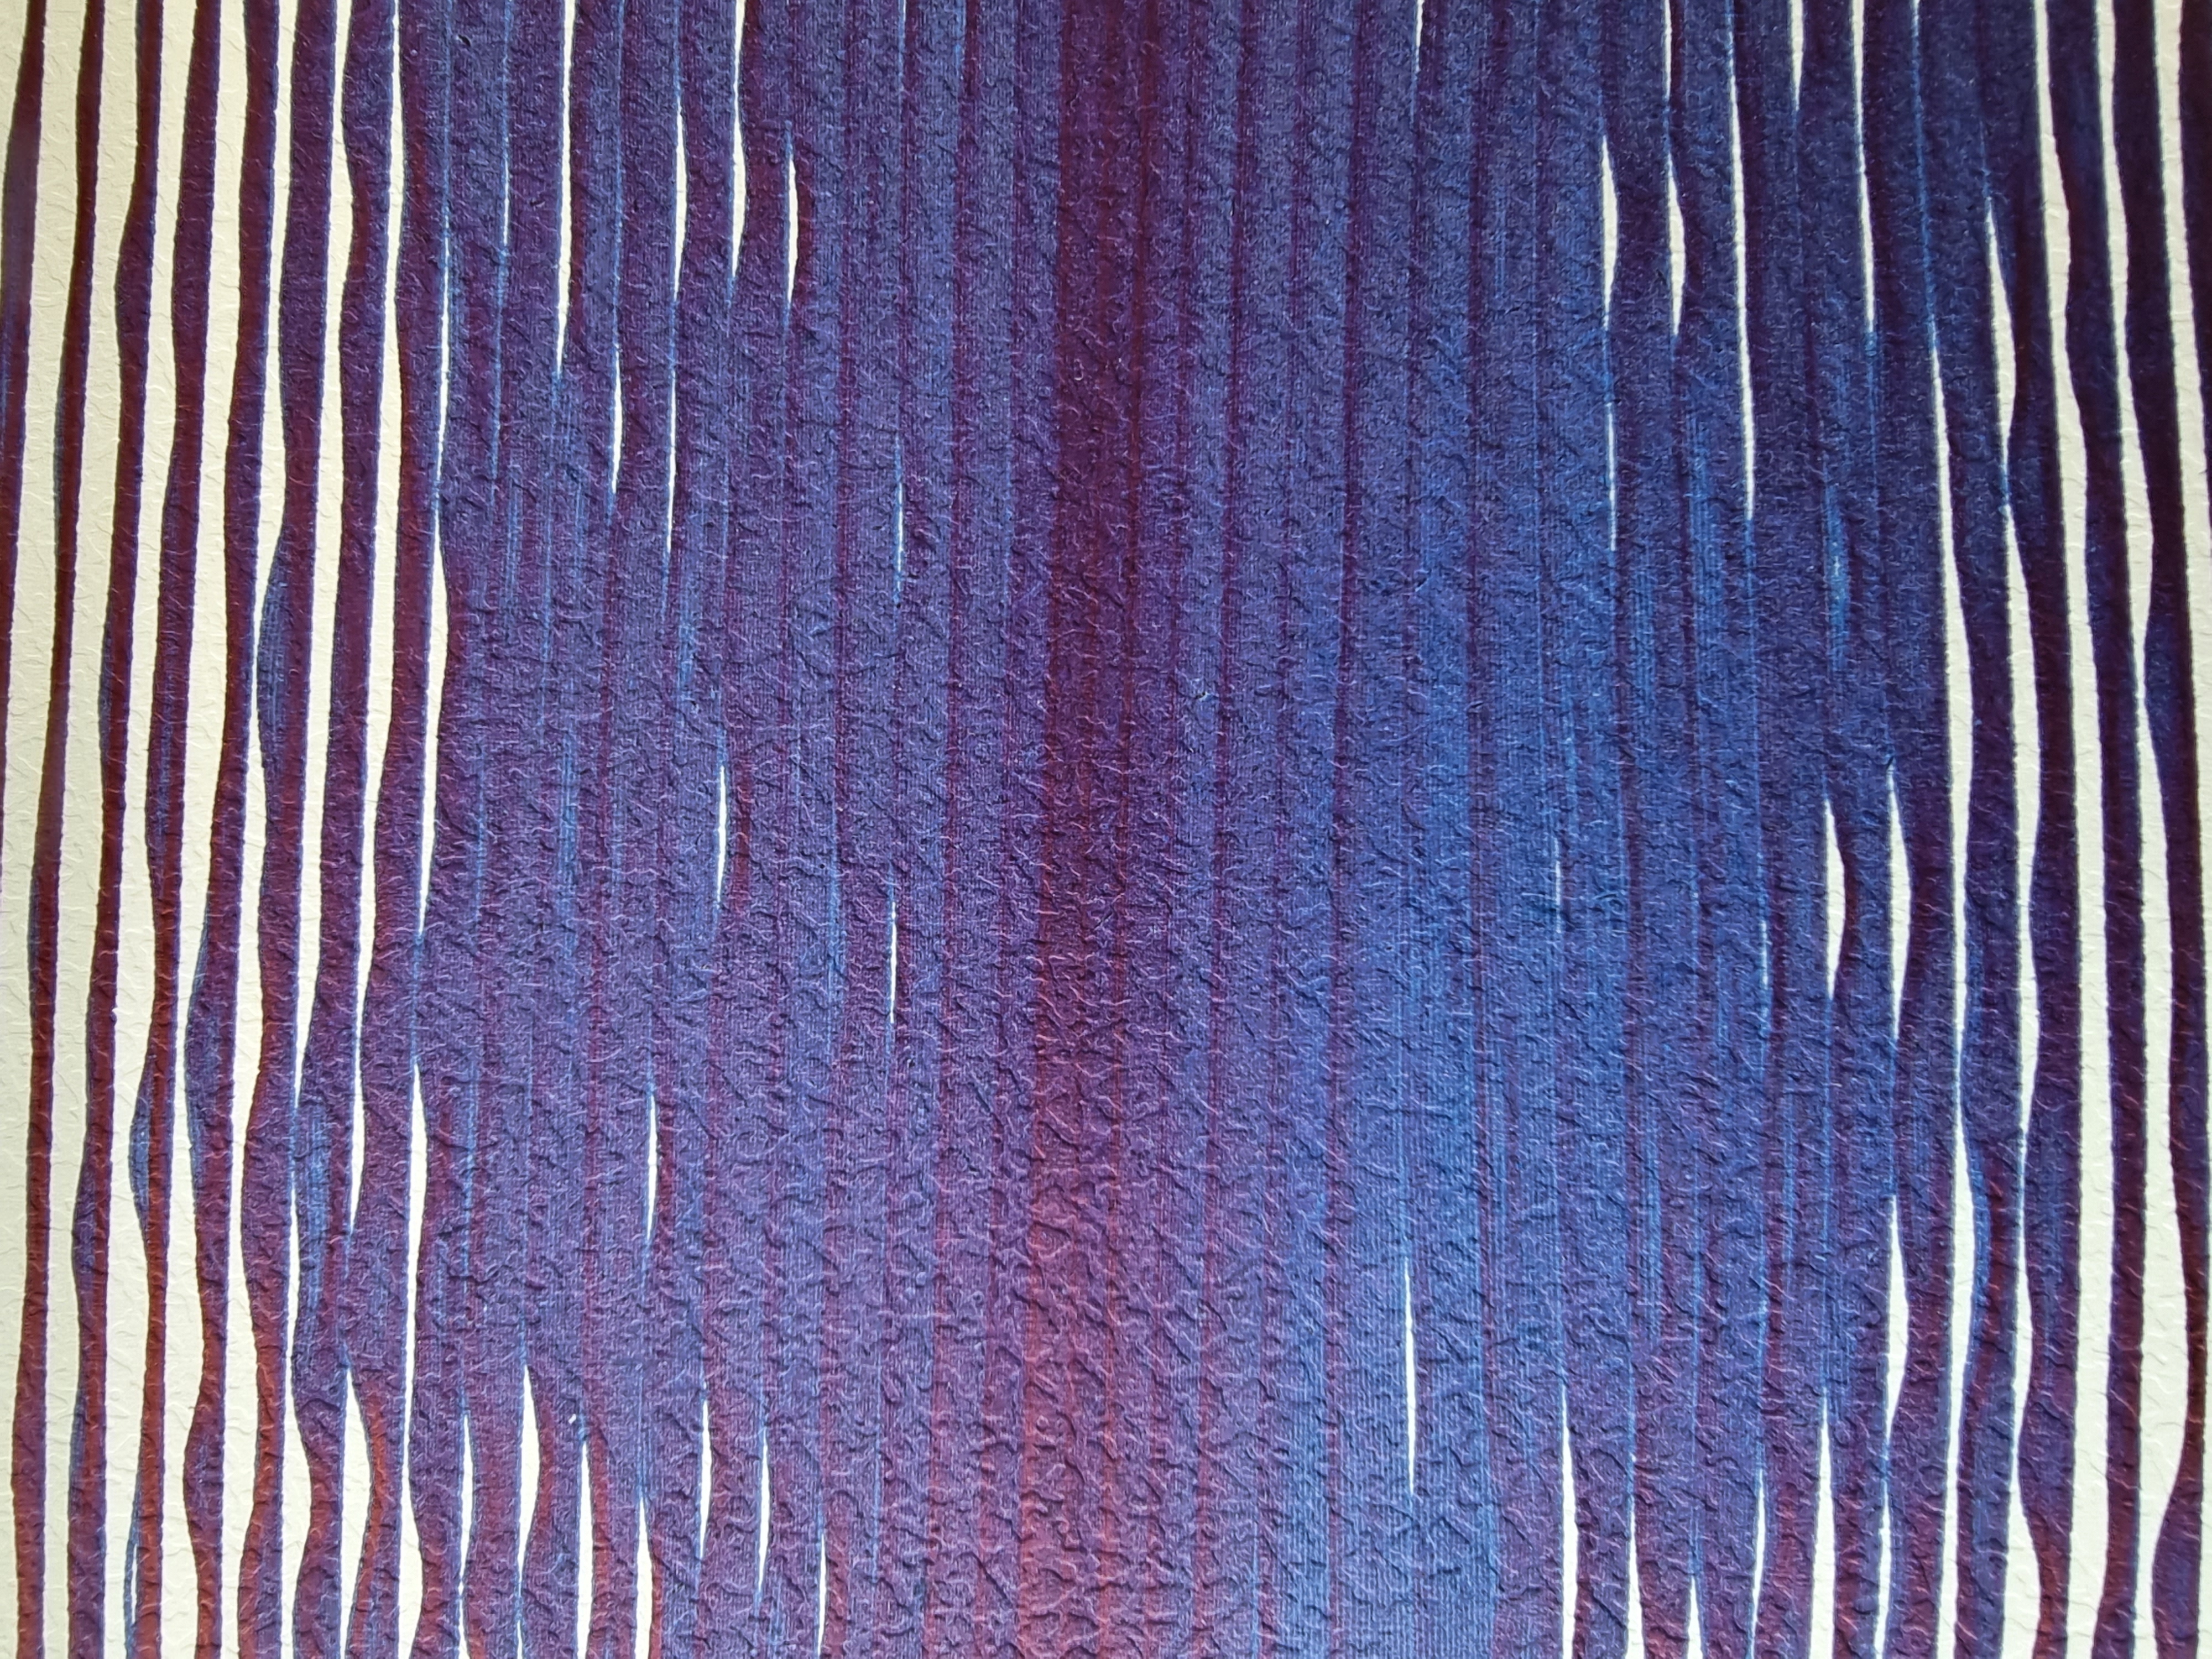
f main driver of curves
What I call f is a function that drives the sublines positioning and effectively makes them expanding or collapsing into one same line.
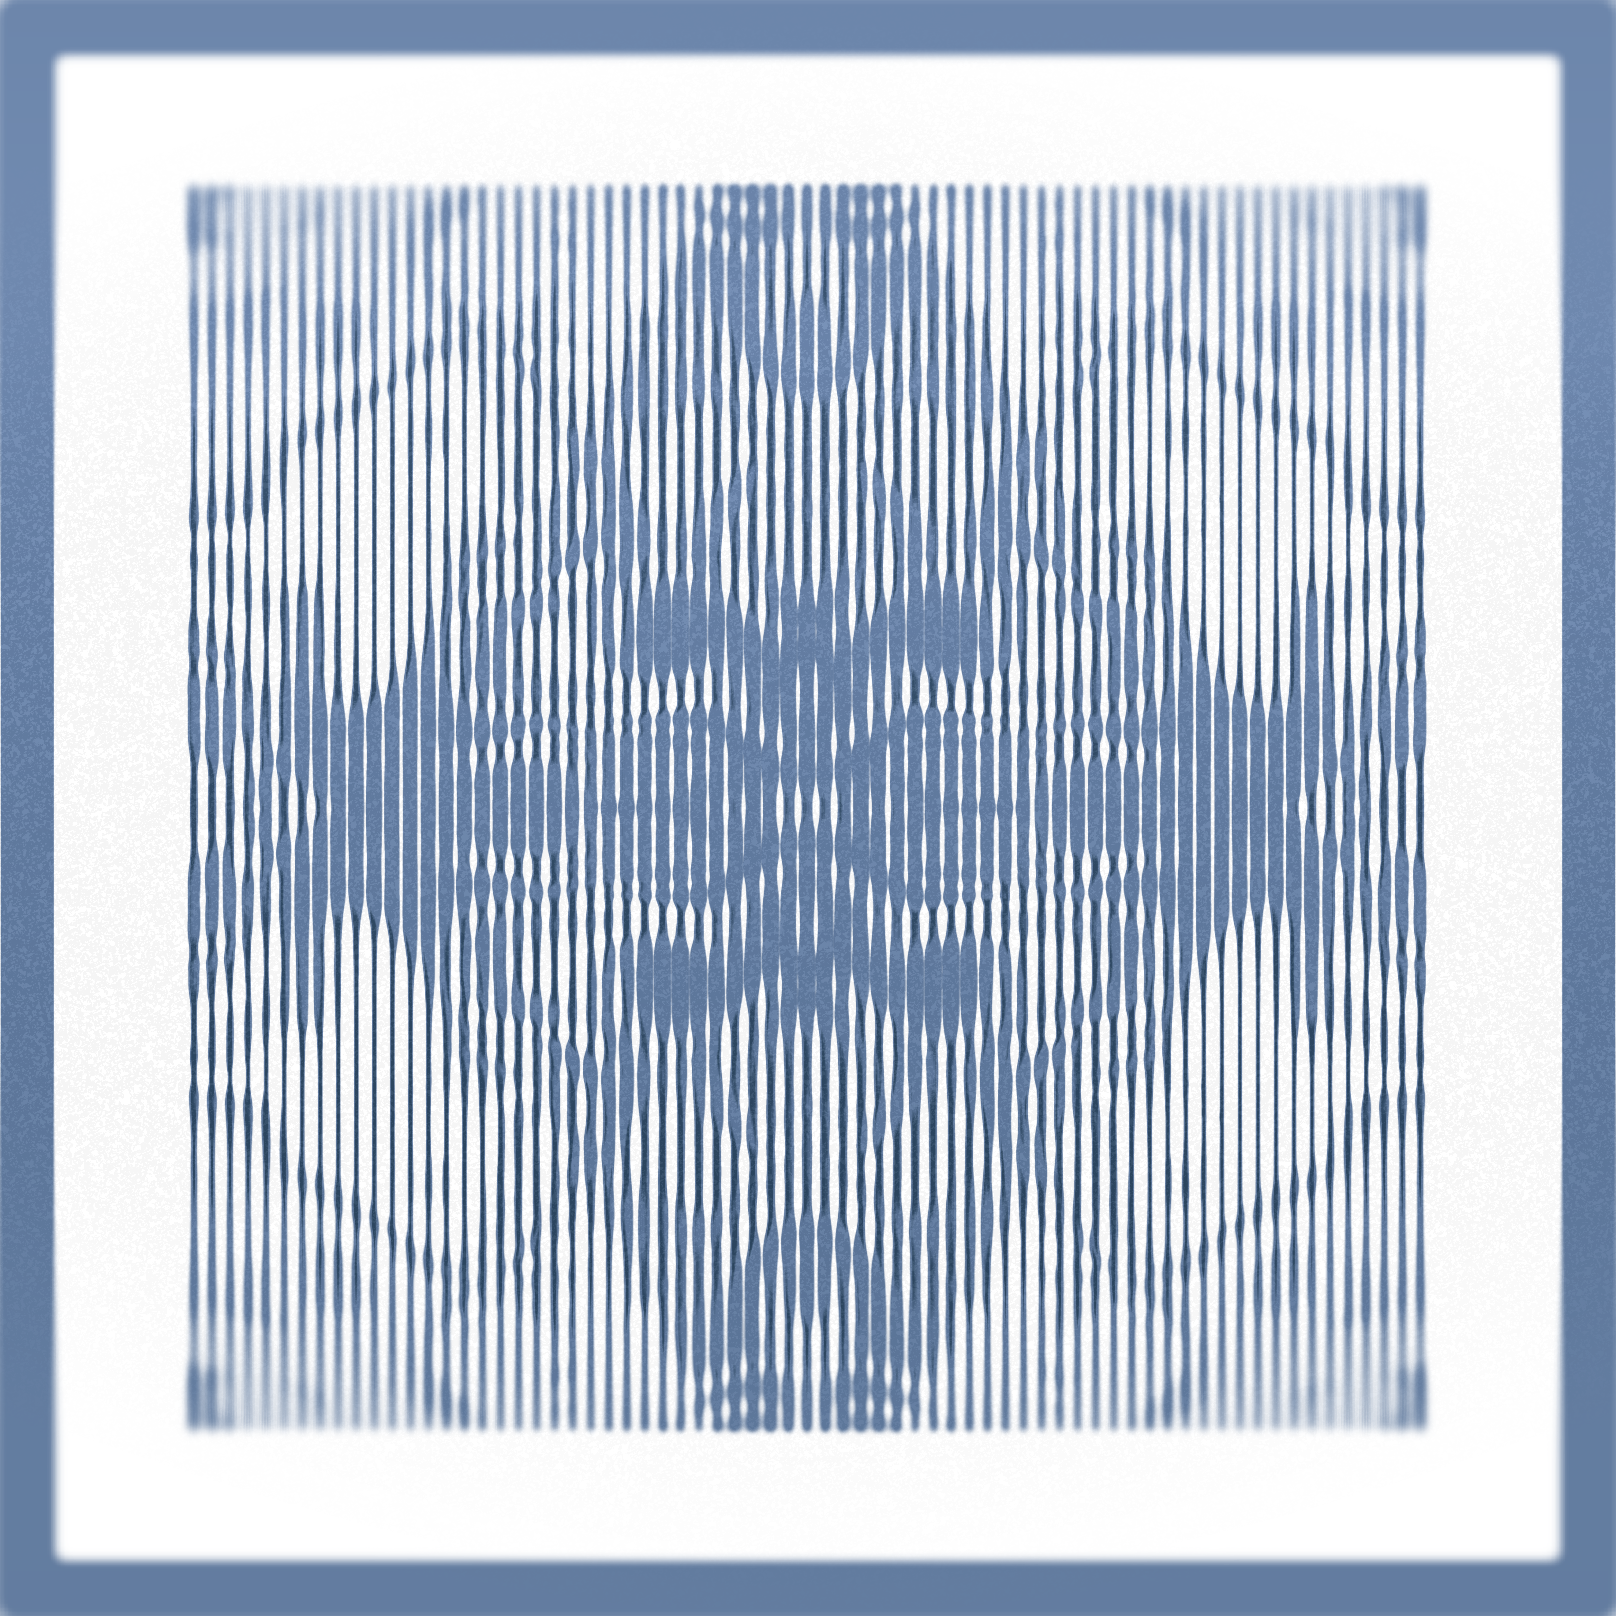
It is implemented using various noises and combined with different techniques. The following plot is covering most of them:
- the general noise effect is the most common feature here and is available 99% of the time (not having this noise is rare). It is built with Simplex Noise and domain warping.
- the circling is an added feature that is not very common. It can have various properties.
There are also other cases like the fact lines would sometimes stop when the f values goes below 0.0.
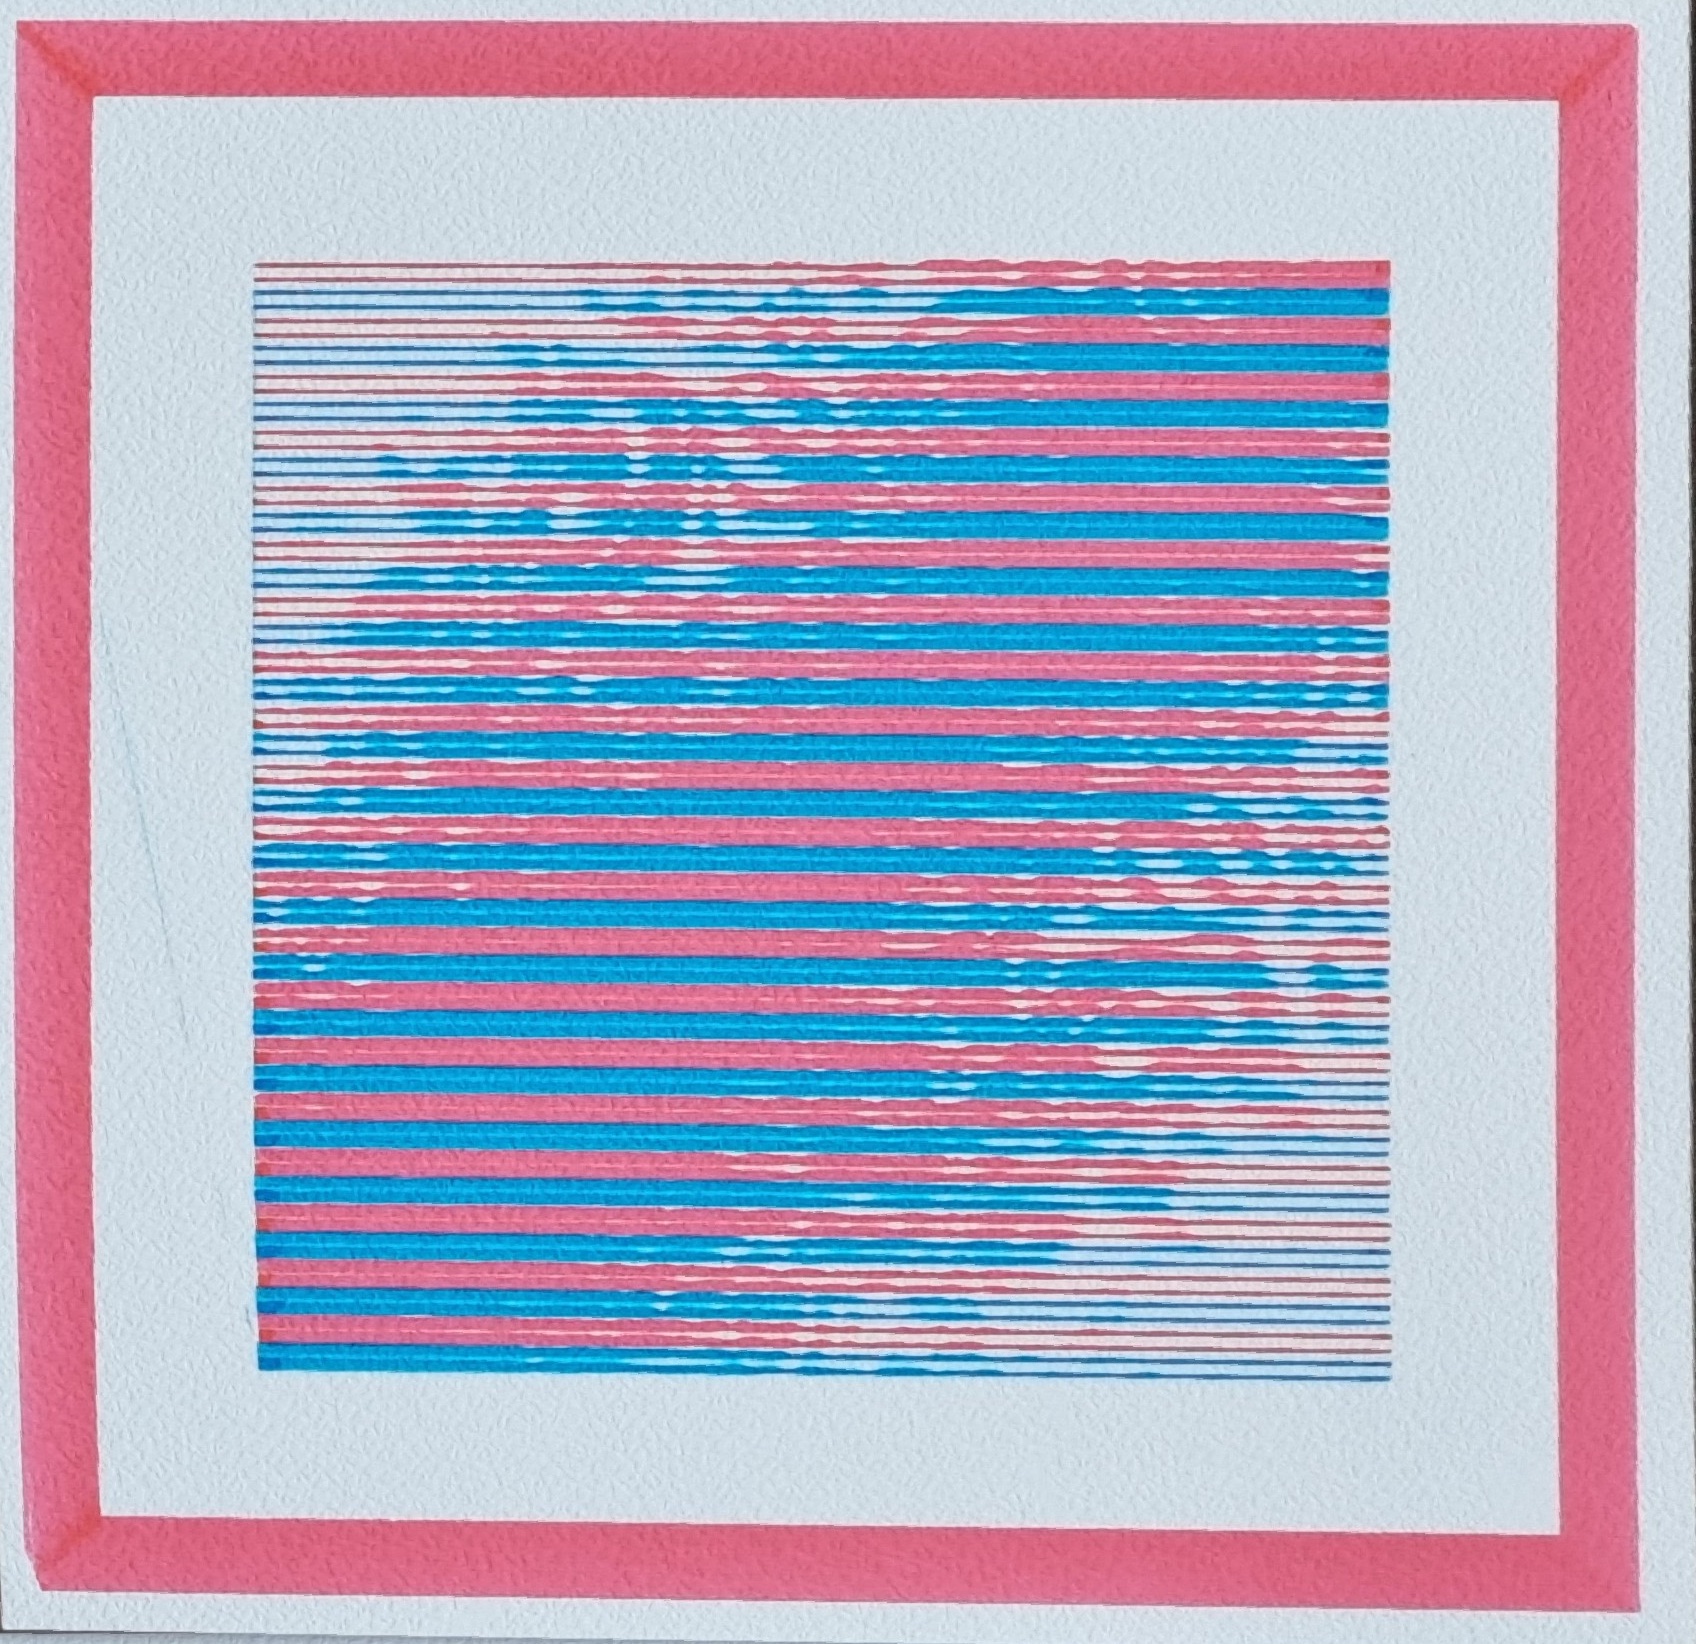
displacement second driver of curves
Displacement is a similar yet different technique. It allows displacing the whole lines independently of the f values.
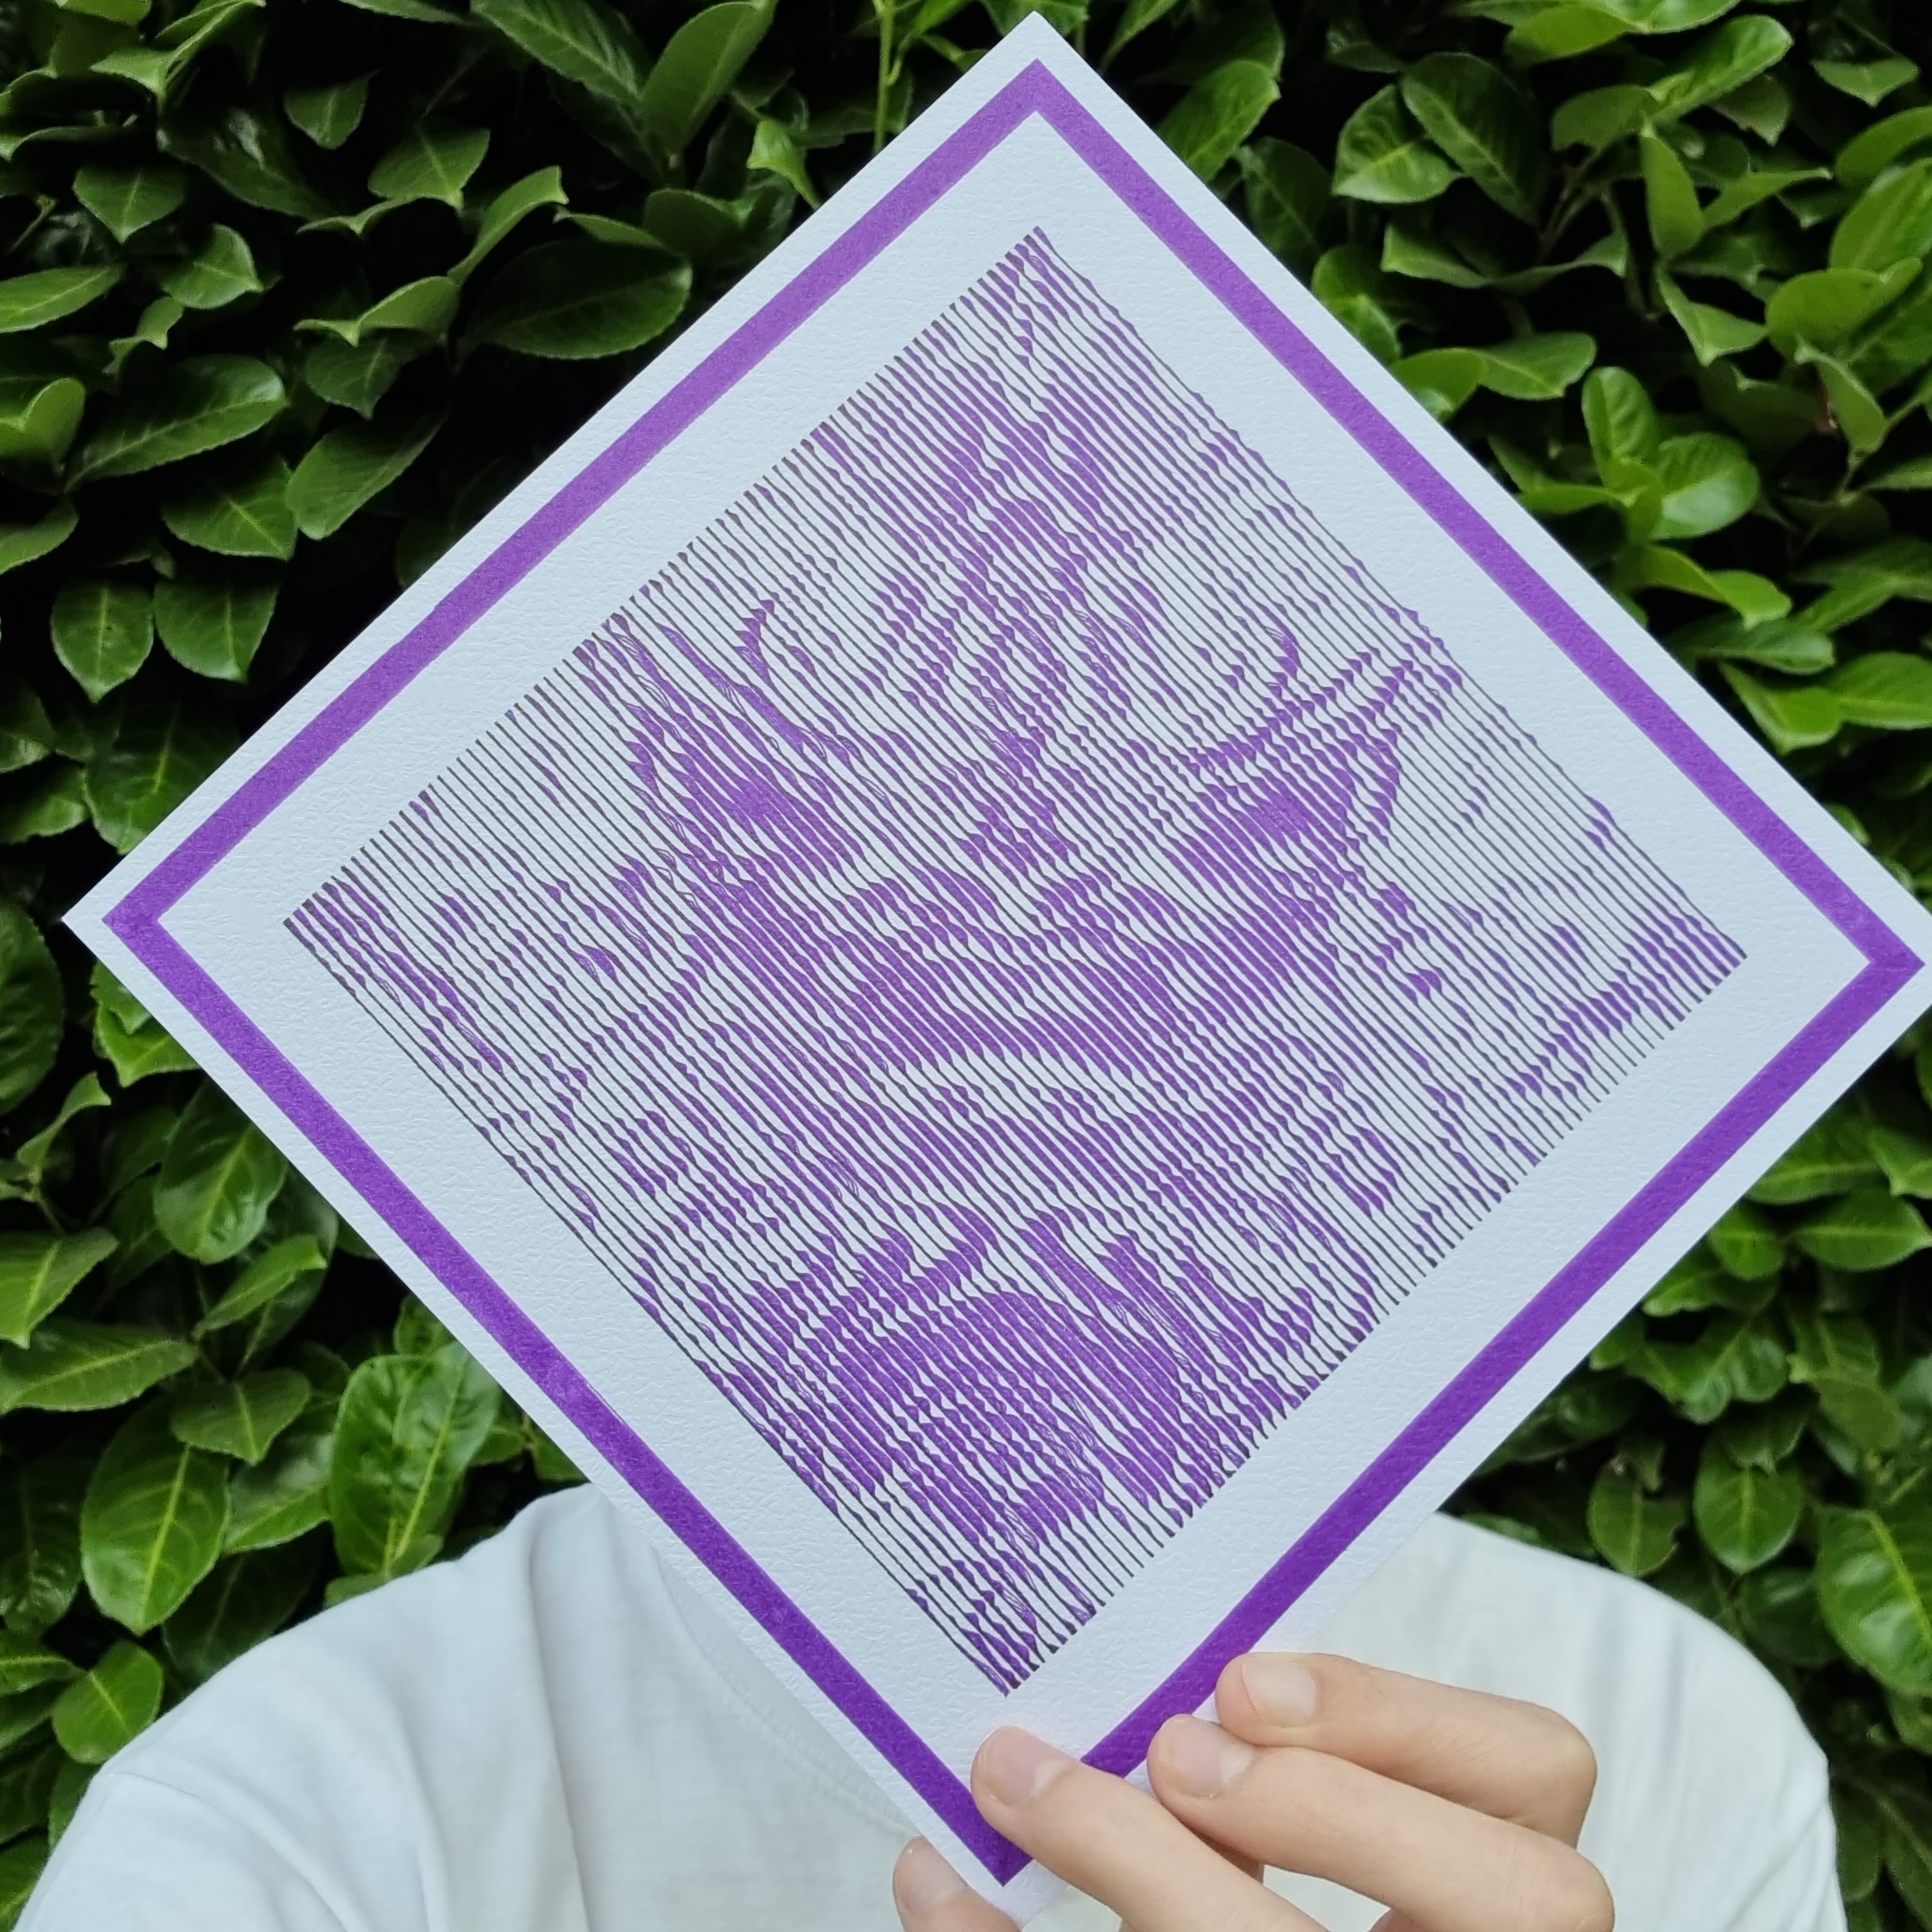
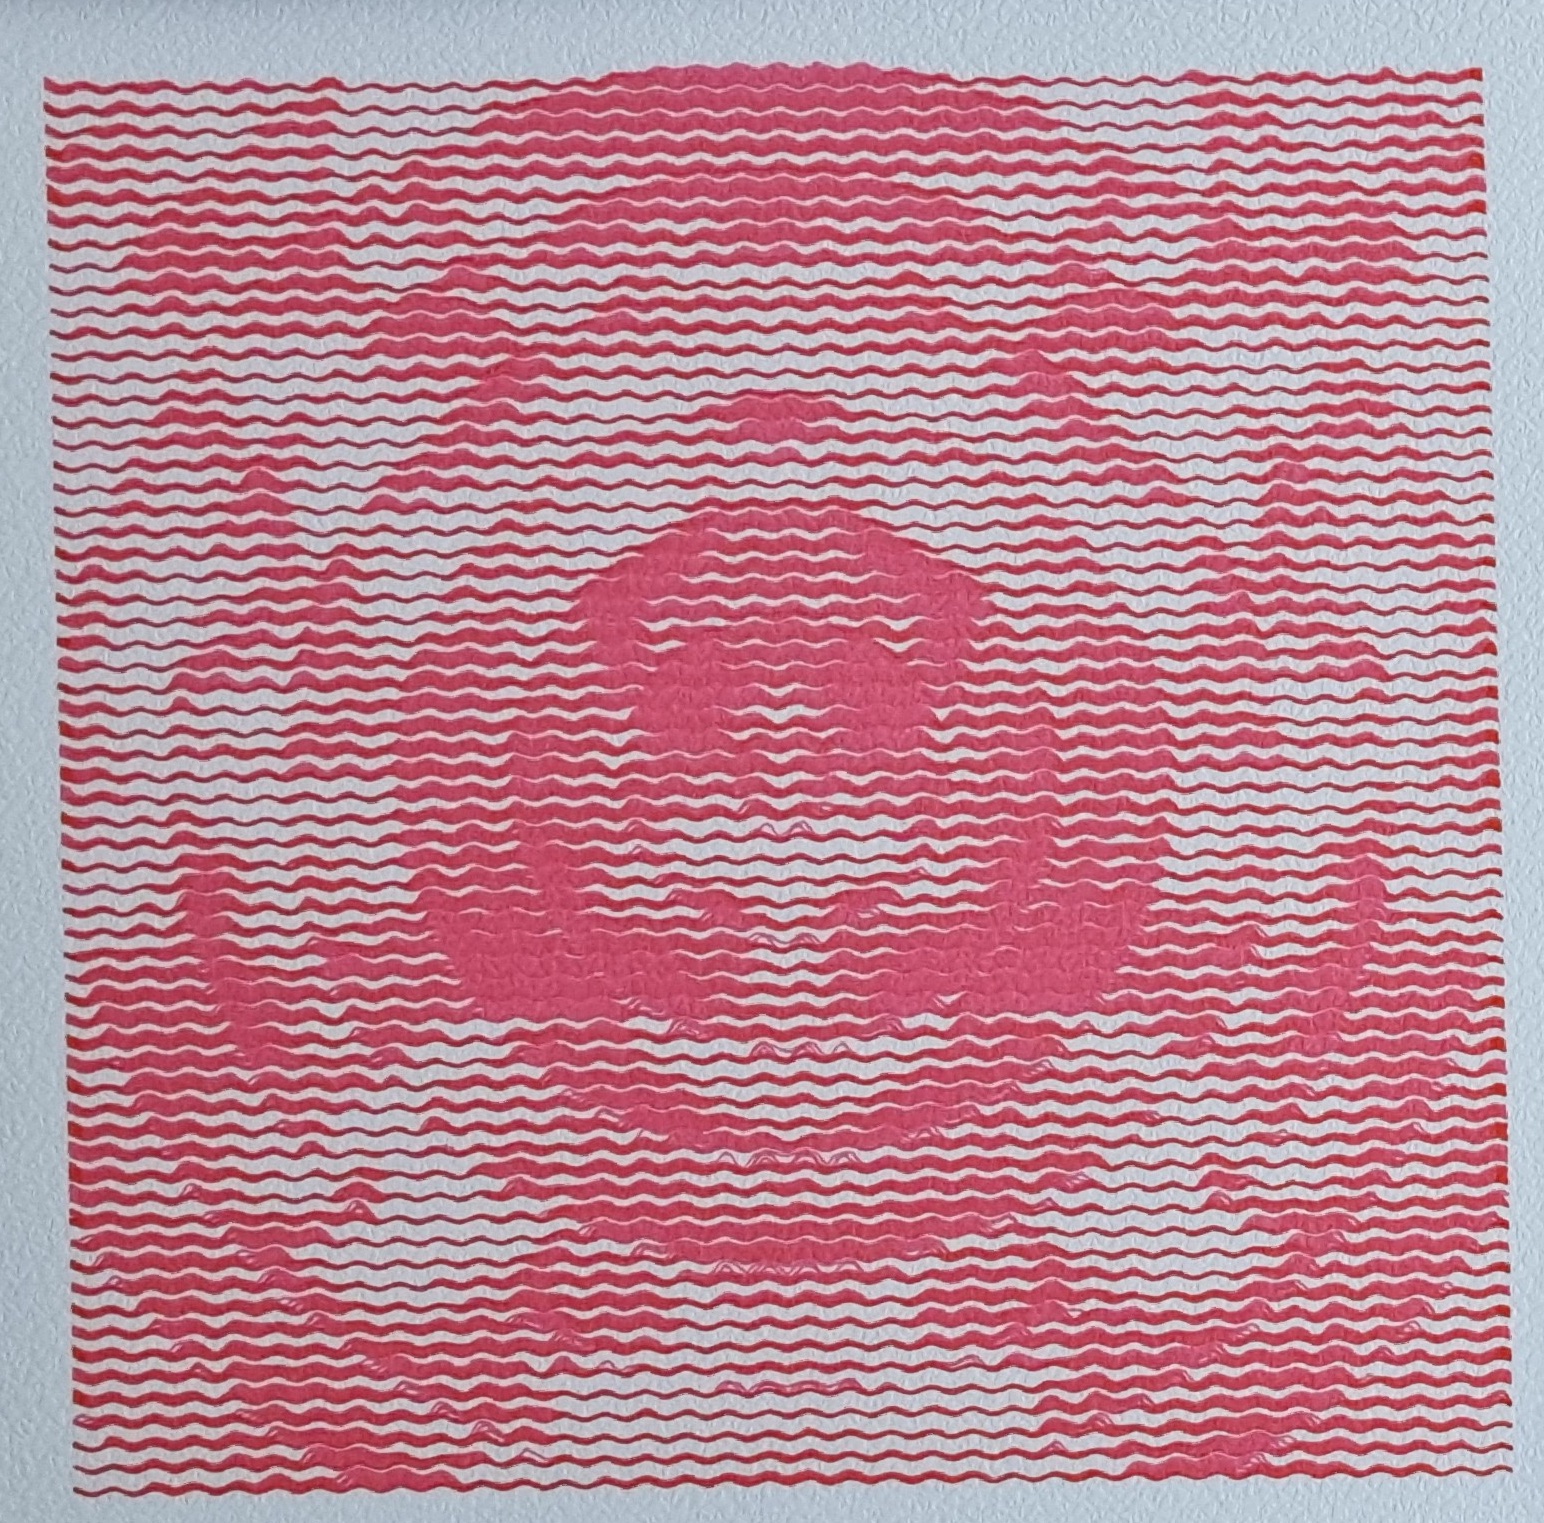
- The waving effect seen in the pink image above is produced with simple trigonometry.
- It can aggressively make lines moving a lot, even "looping" sometimes.
Displacement is overall a relatively rare feature. It is also one possible source of trouble for plotting (can dig the paper if you draw too much at the same place!) so it was pretty well contained.
Here is an example of displacement with aggressive settings:
It looks like a photo but this is actually the digital version!
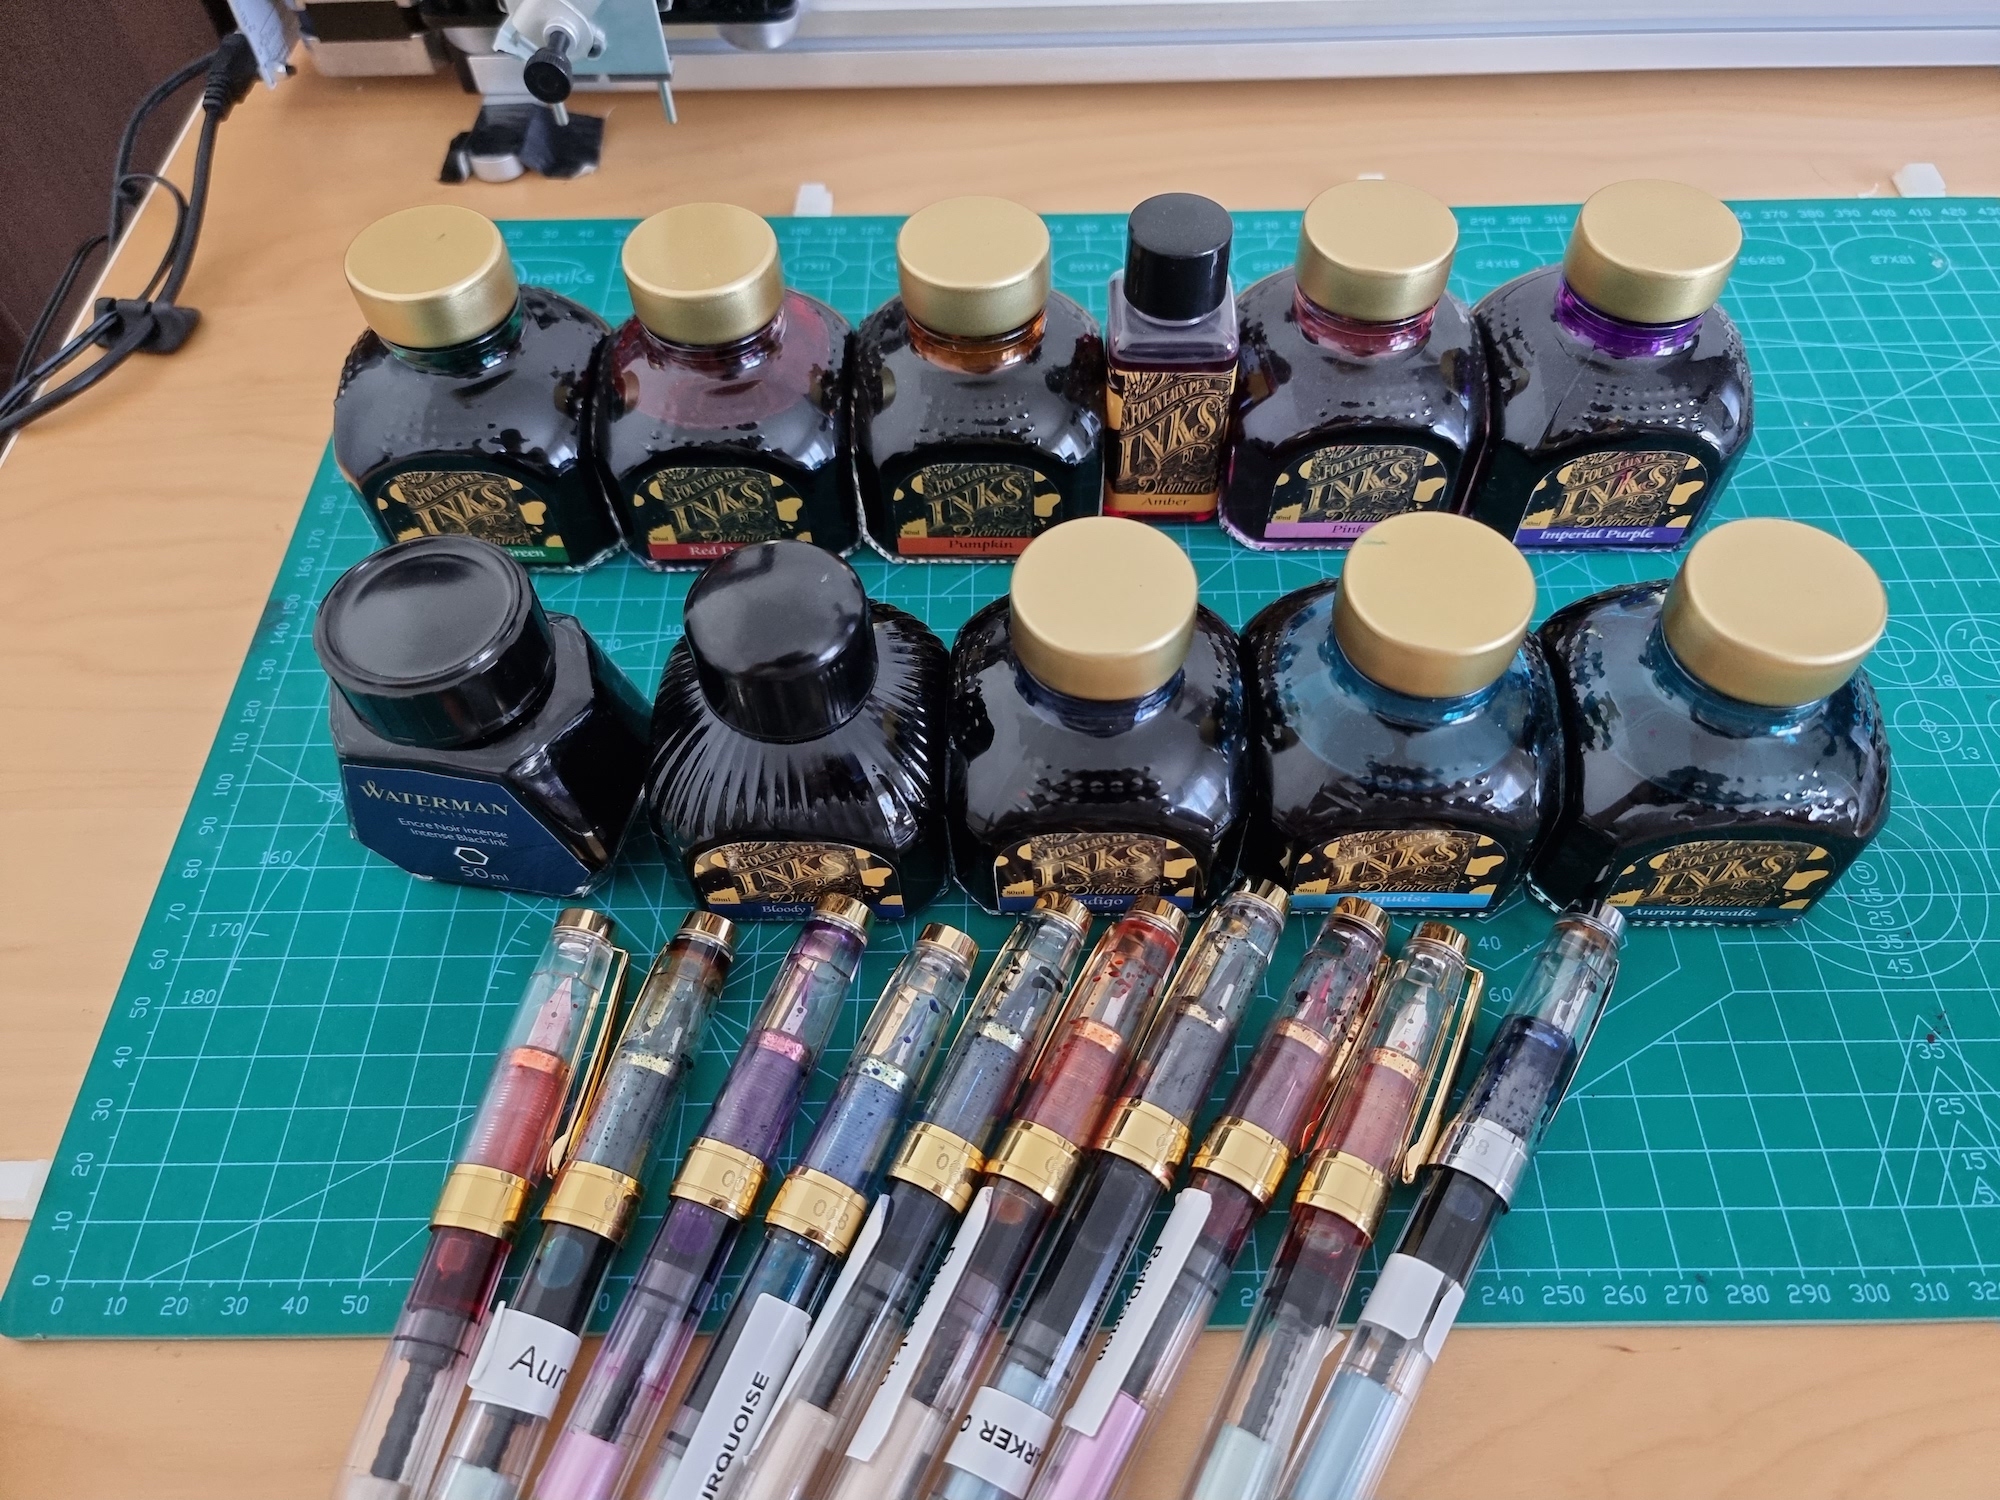
Inks and colors
The curator-artist chose one color among 11 inks. Each ink has various properties and some are very vivid. I would overall recommend black which produces very good contrast plots, but it's great to have the general possibility.
There are some plots that have color duality and that can also be plotted:
This is a prototype and I was not careful as the corner and the final line scratch. Plotting is a challenge!
Plot optimizations
A plotter is a machine that follows your drawing paths, here using SVG. When you do a SVG <path> every move (M) will be an actual move so you got to avoid useless moves. As it's easy to "move to the start" in algorithms, something that should not happen here.
Sometimes, the pen also was going up where I planned to "continue", this was the case of the initial algorithm of the "rectangle spiral", I avoided doing moves and preferred to connect lines.
To optimize the traveling of plotting lines, I've made it go back and forth: The first line is drawn from left to right, the second line gets drawn from right to left, and so on... This allows to avoid too much undesired ink accumulation or other pen/paper issues by alternating the direction.
Another problem I've optimized is the order of plotting lines and sublines. Instead of plotting all sublines in once, I preferred to plot the first subline of each line, then the second subline of each line, and so on... Despite the small extra move it requires, it's very important to balance the ink evenly as some inks tend to "dry" a bit over time which makes the drawing "fade away" as it flows. What's interesting is you can see the fading happening on each line:
which is something I've simulated on the digital piece too! The effect varies from one ink to another.
See also how the ink behaves on this photo? accumulation of this ink produces red-ish colors. Something that can be observed on the digital generator as well!
Technical stack
Technically speaking, I believe this is the best achievement I did in a few years and profoundly refreshing. I managed to connect my creative coding pipeline: Rust generating SVG files, used through WASM and post-processed in WebGL to add extra effects and simulate the ink drawing. This was a blast to put these all together and I feel I've found something I'll keep doing in the next weeks and months.
The choice to use Rust was initially a personal exploration, using a language that is meant to be performant while being relatively high level and functional. It's something I did initially for plots and it helped on time-consuming algorithm. I've used it here for two reasons: first of all, most of my tooling for plotting is written in Rust, I'm very fluent it in now and I have many helpers I could reuse, secondly, there is a gain of performance. I have initially written my code in JavaScript and had some bad performance on the simple templating of the SVG code, I've estimated a gain of about x2 on the performance of using Rust. There are no super complex algorithms here, but it's still 2-3 loops with big iterations on them. The performance overall can still feel a bit slow, but you have to imagine each mod changes regenerate the SVG that can be up to 4 MB of XML.
I didn't try to enable asynchronicity or parallelism but it's something I will dig in the future when I'll do more complex work like shape packing (that can require parallelization).
This is a melting pot of technologies as I had to work on 3 aspects:
- In JavaScript is managed the logic that handles mods and block data and bakes the "parameters" of the generator.
- In Rust is implemented the generator itself, taking parameters in input and resulting SVG file.
- In WebGL/GLSL and gl-react library is implemented the simulation of ink on paper rendering.
NFT and physical pieces?
The release of "Pattern 03" on EthBlock.art is primarily "digital" NFTs. Every BlockArt is going to be a digital NFT that includes the SVG recipe to make it physical.
The physical collection is not meant to be 1 physical for 1 digital. The idea is that the digital NFT remains unique but the physical art can be explored in different ways or ordered multiple times, it will not be guaranteed unique. Actually I can't prevent the plot to be done X times, like anyone can draw X times a La Joconde. However Nature have randomness and each physical plot will be unique.
This is by design decoupled.
There are curators that prefer digital art, this is the BlockArt. There are curators that may be interest by the physical version.
The "physical artist" do not necessarily need to be the same as the "digital artist". The idea here is the art goes beyond me, the digital pieces are recipes and a community of plotters could be using these digital pieces in different ways under different terms and with their own tools. This is the openness of blockchain and NFT and this is secured by the contracts and the ownership of NFTs.
What I plan personally to do "as a physical artist". Now that this decoupling is explain, let me take the physical artist hat. As physical plot have some cost, there are many ways to cover this. Indeed the simplest way is just to sell physical goods like a regular marchant.
As I said before Nature have randomness and each physical plot will be unique.. As a physical plot is still unique, I will emit an NFT each time I plot something.
In my case, there will be two ways of buying the physical piece:
- Either you will be able to SWAP your digital NFT against the physical NFT. And physical art will be shipped physically to where you want.
- Or you will be able to BUY it, but the price will be intentionally HIGHER than the digital NFT / will be following a bit the "floor price" of the digital NFTs of the collection.
I will also be the one to chose what I plot, I will not necessarily "plot them all" (but I can take requests) and I will not necessarily keep a 1:1 relationship as shared before. Actually, if you chose the SWAP option, I will have back the NFT digital, this is the way I get "paid" as I can then put it back on market.
I believe this ecosystem will be amazing and will allow a lot of options and freedom. I am so thrilled by the possibilities of NFT.