greweb.me / Plots 
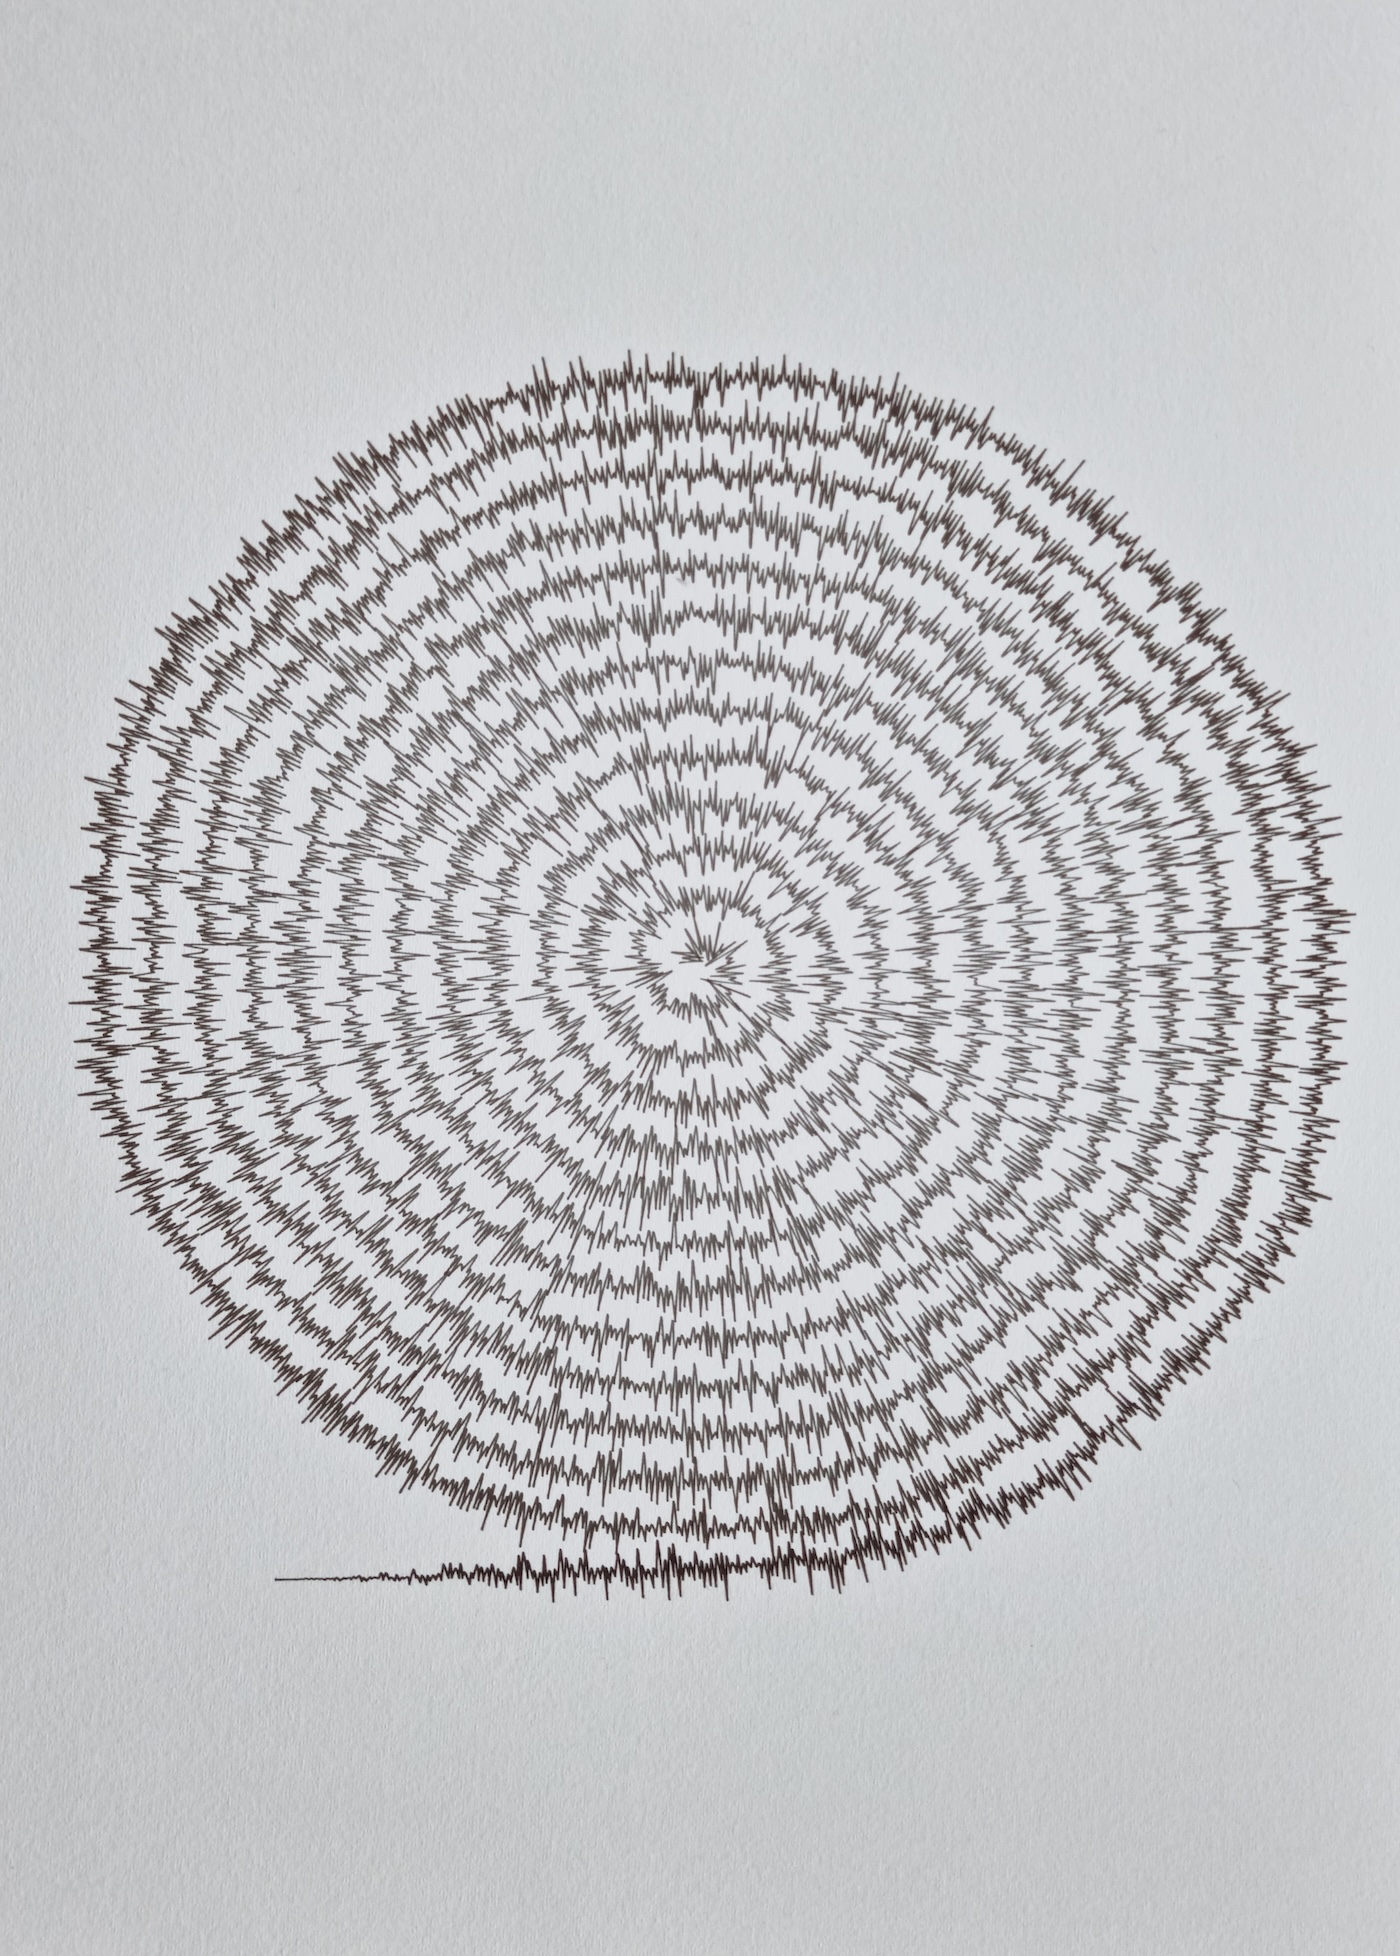
/ 1360 "10'000 datapoints"

for Genuary 2024 16, we visualize 10'000 datapoints on a spiral curve.

As a generative plotter artist, I use code to generate art (creative coding) and physically create it with pen plotters, which is itself a generative process – each physical plot is a unique variant. I love dualities, like digital vs analog physical, abstract vs figurative, orthogonal vs polar, photo vs noise,...