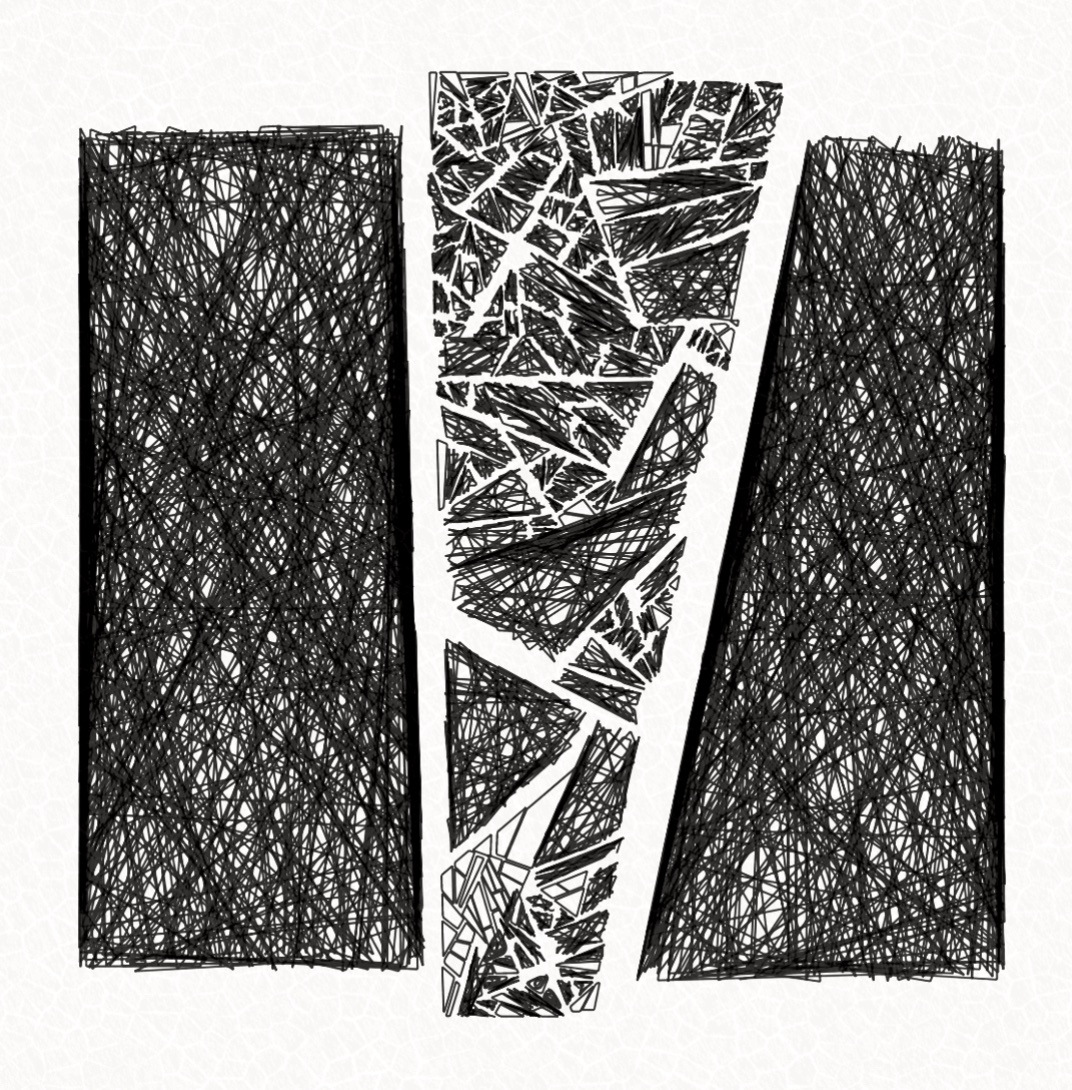
"Shattered" is a new generative and plottable art that will be released the February 23rd, 2022 (6PM Paris time) on the emerging platform https://plottables.io/.
Shattered [adj] – broken into many small pieces.
This plottable NFT generator visualizes the explosion of polygons (e.g. squares) into pieces then rendered using different filling techniques and suggested inks. There are various rare cases to discovery, like the shape, filling method, alignments,...
The plots are designed to be plotted with fountain pens and on A4 paper, but the plotter artist is free to do any interpretation they want, chose different colors, different paper techniques, the possibilities are endless! Depending on your configuration, the plot can take between 15 minutes to a few hours to execute.
@greweb can ship plotted editions to NFT owners with a small extra cost via https://greweb.me/plots/nft
Physically plottable?
Like in my previous article, the generator produces "Plottable NFTs".
A Plottable NFT is, like regular art NFT, a token to a digital artwork that can be sold and resold on a second market – blockchain guarantees its unicity.
The Plottable NFT also gives a privilege to its owner: making or requesting a physical plot (with an artistic fee to cover costs, see /plots/nft). As a physical work can be executed multiple times, every physical piece remain unique: plotting is an analog process that will inevitably yield different results.
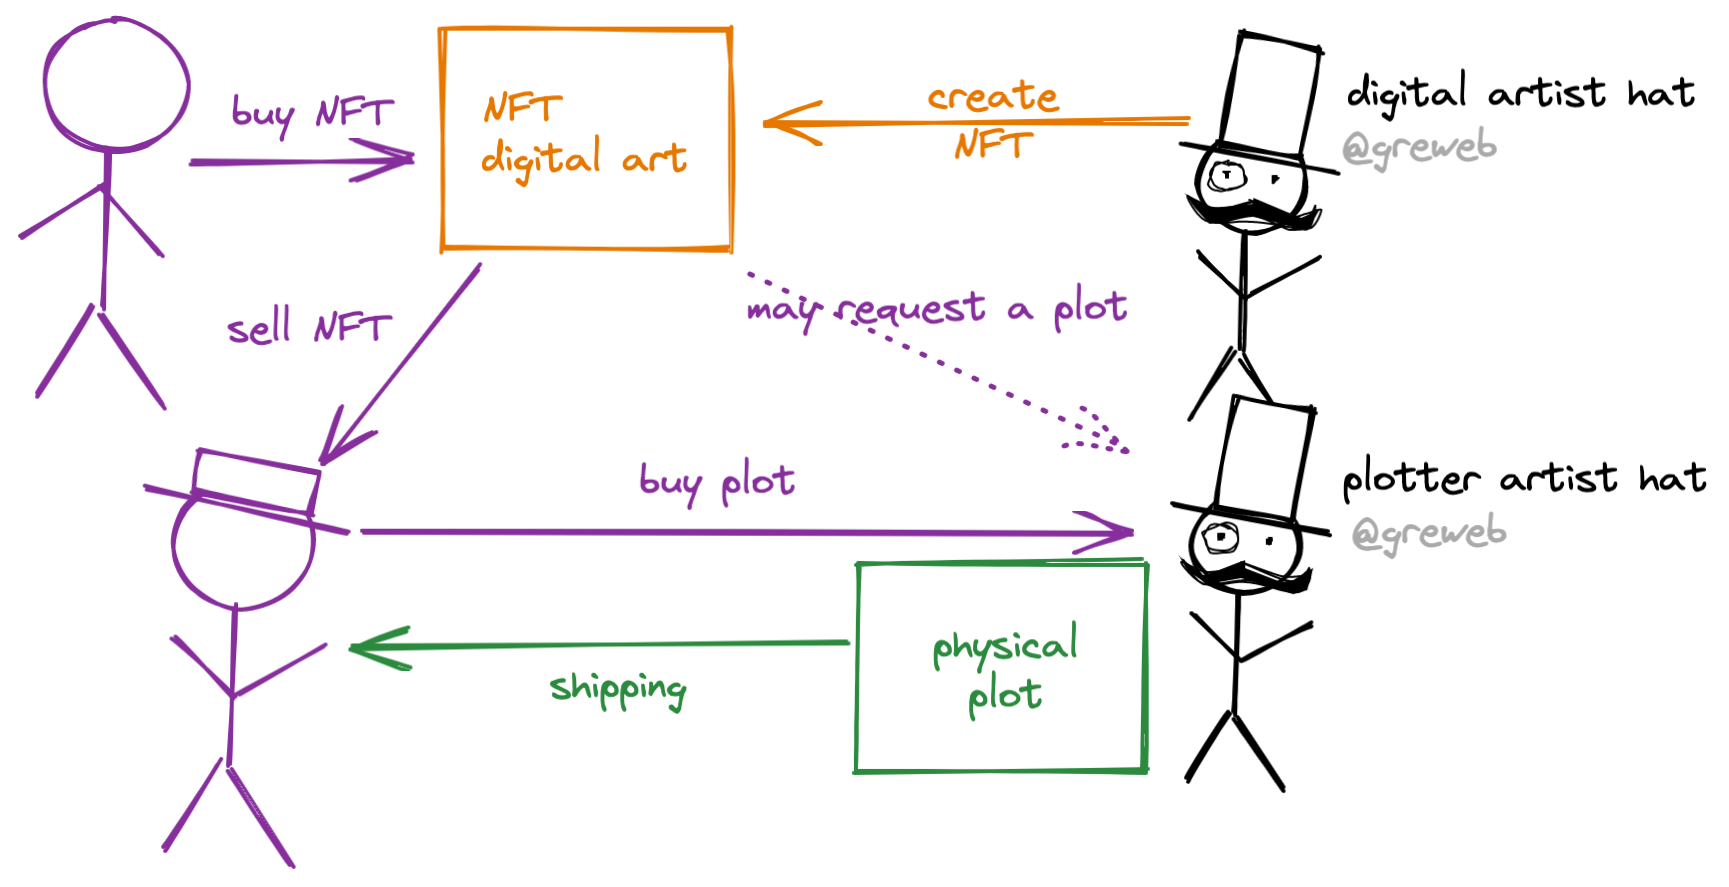
https://greweb.me/plots/nft sets my own "plotting services" terms but any other plotter artist is welcome to collaborate and contribute to offering to the community their own services under their terms and interpretation of the art – I would just ask to verify that the requester owns the NFT.

You can also be your own artist, buy a plotter, try it out! This is all designed to be open-source friendly and you can download the SVG yourself!
Prototype, prototype, prototype
Many prototypes have been physically plotted in order to guarantee the viability of results: plottable often is a challenge when it comes to pen and paper. The density is very challenging to adjust: not enough lines and you miss the opportunity for great ink effects and saturation. Try with too much lines and your paper is melting.
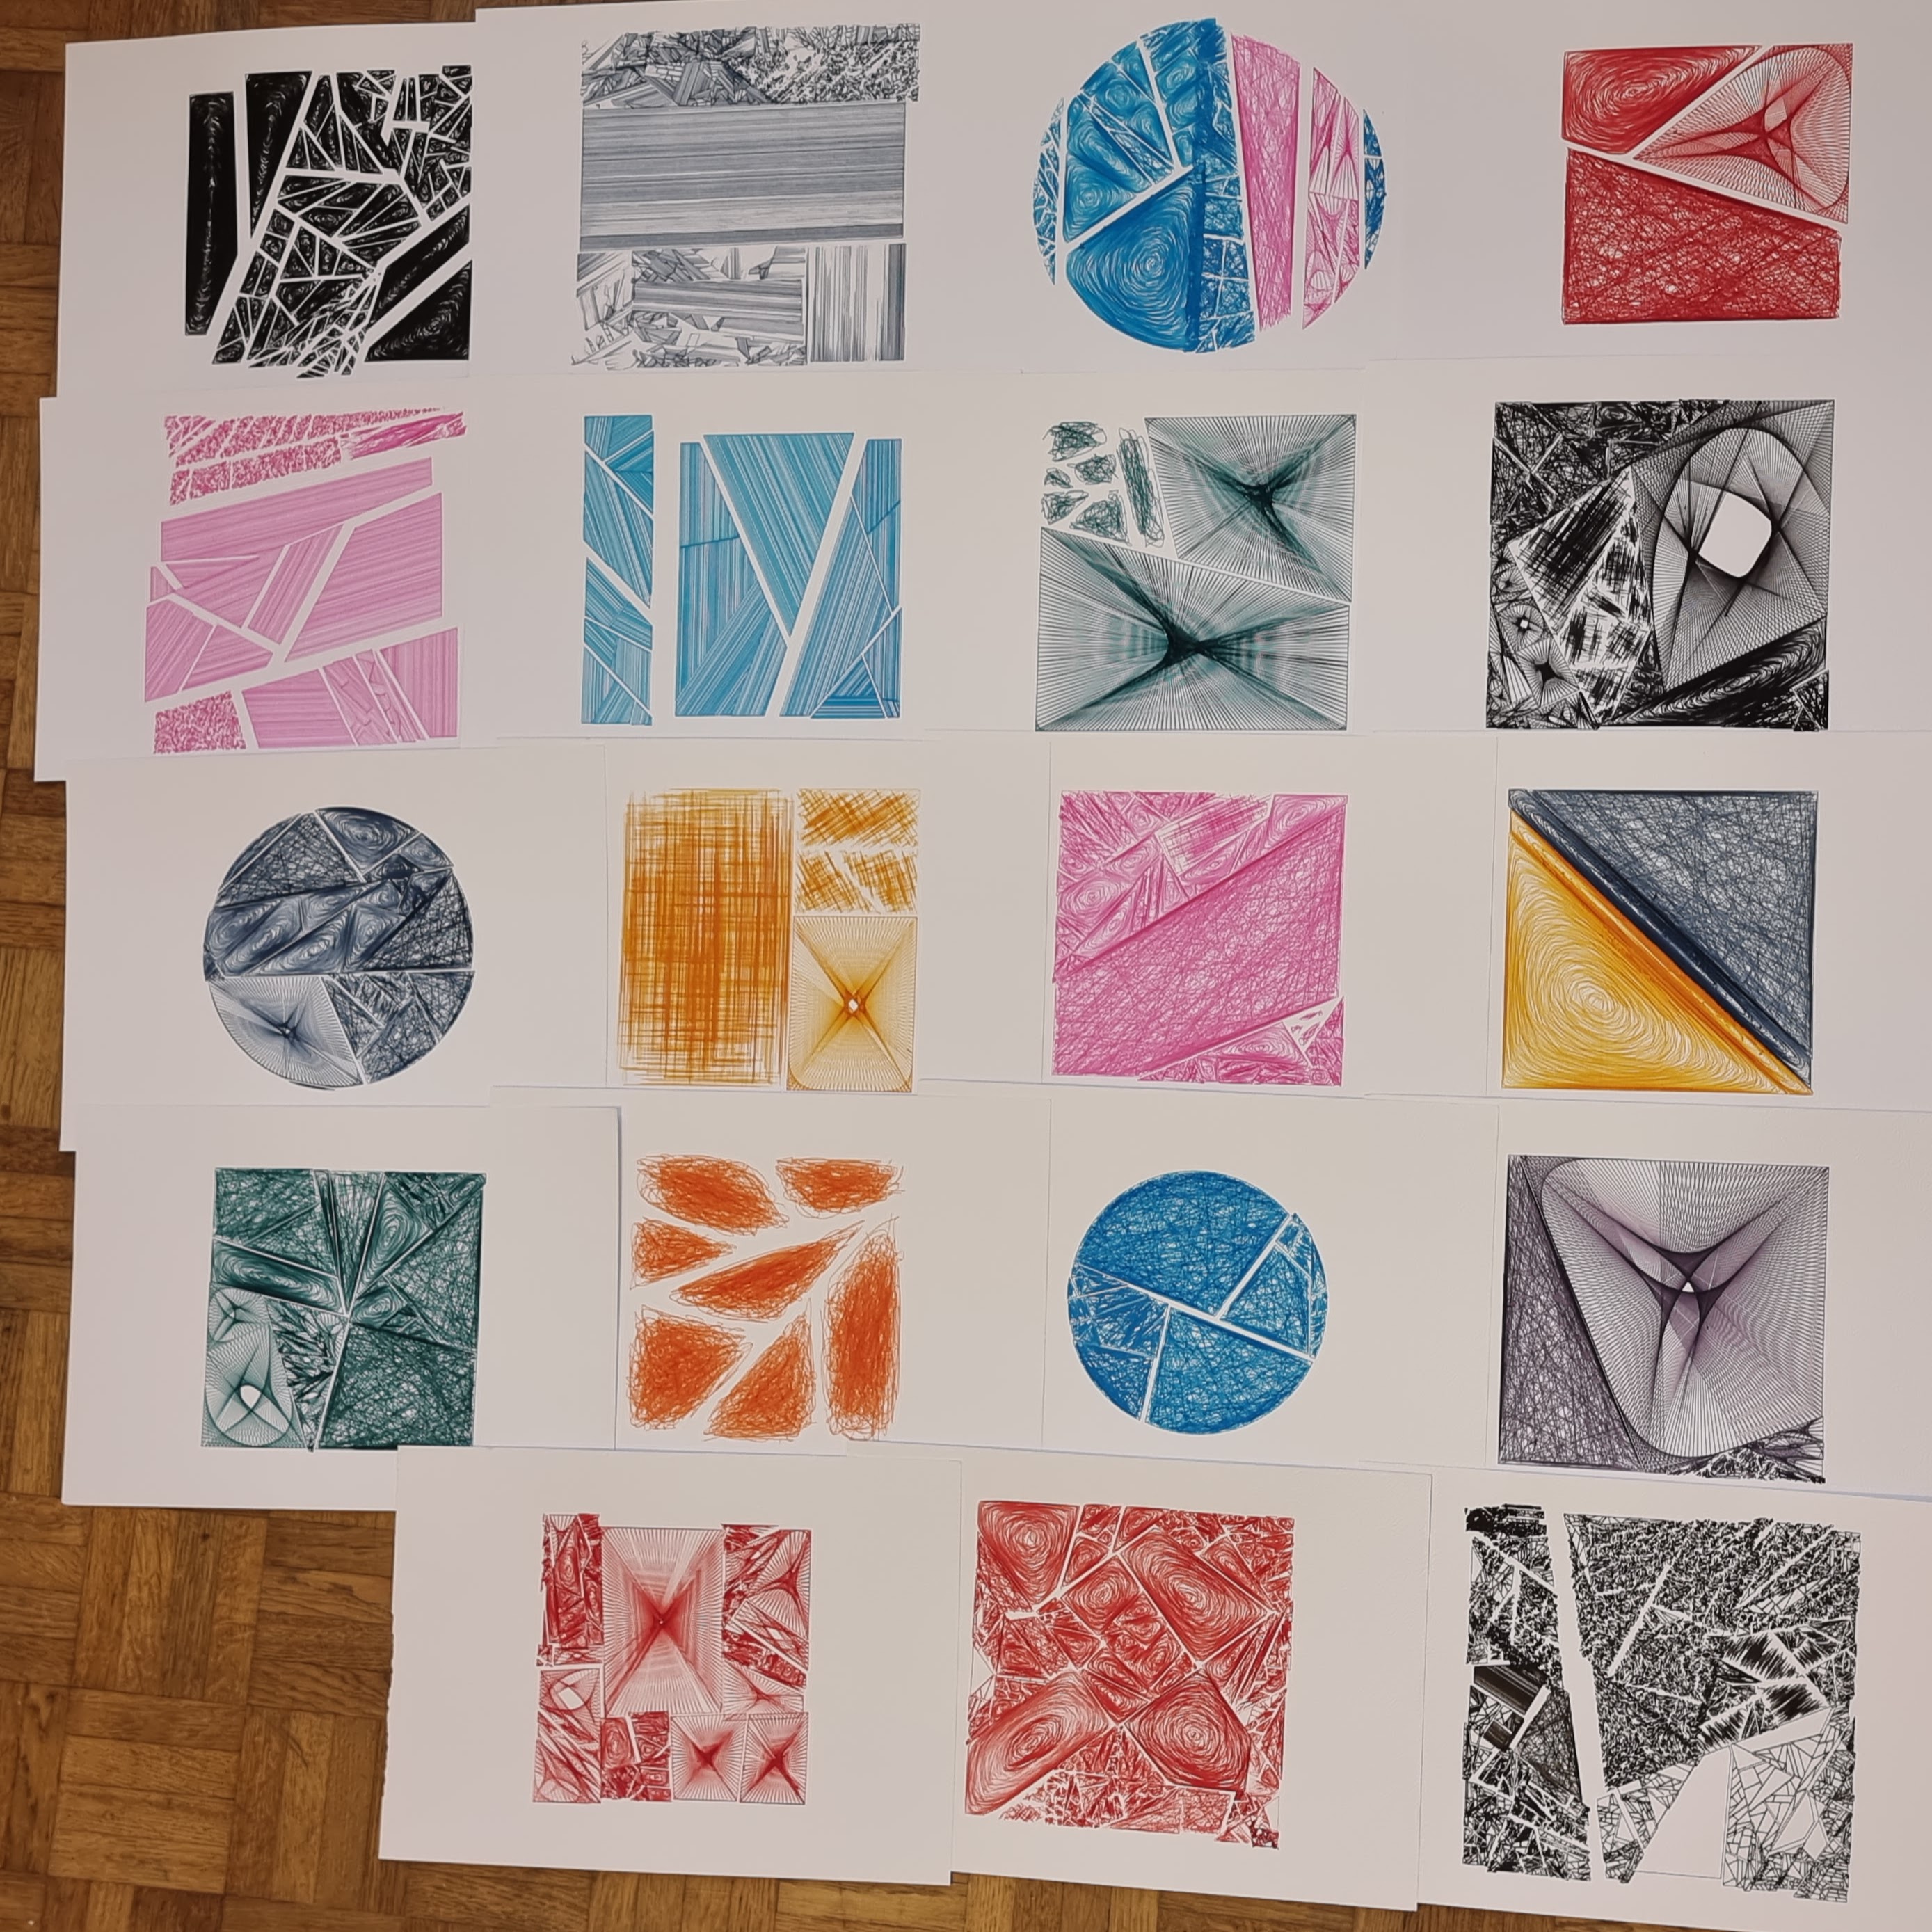
These prototypes helped to adjust the density and tweak the algorithms over the weeks of development.

How does the generator work
The generator works in a few steps:
- Step 1 implements the shattering and outputs polygons.
- Step 2 implements the filling: the polygons are filled with various techniques and colors.
- Step 3 implements post-processing effects. Not only a SVG is generated, but it is also used in a WebGL shaders texture to simulate ink and paper effects.
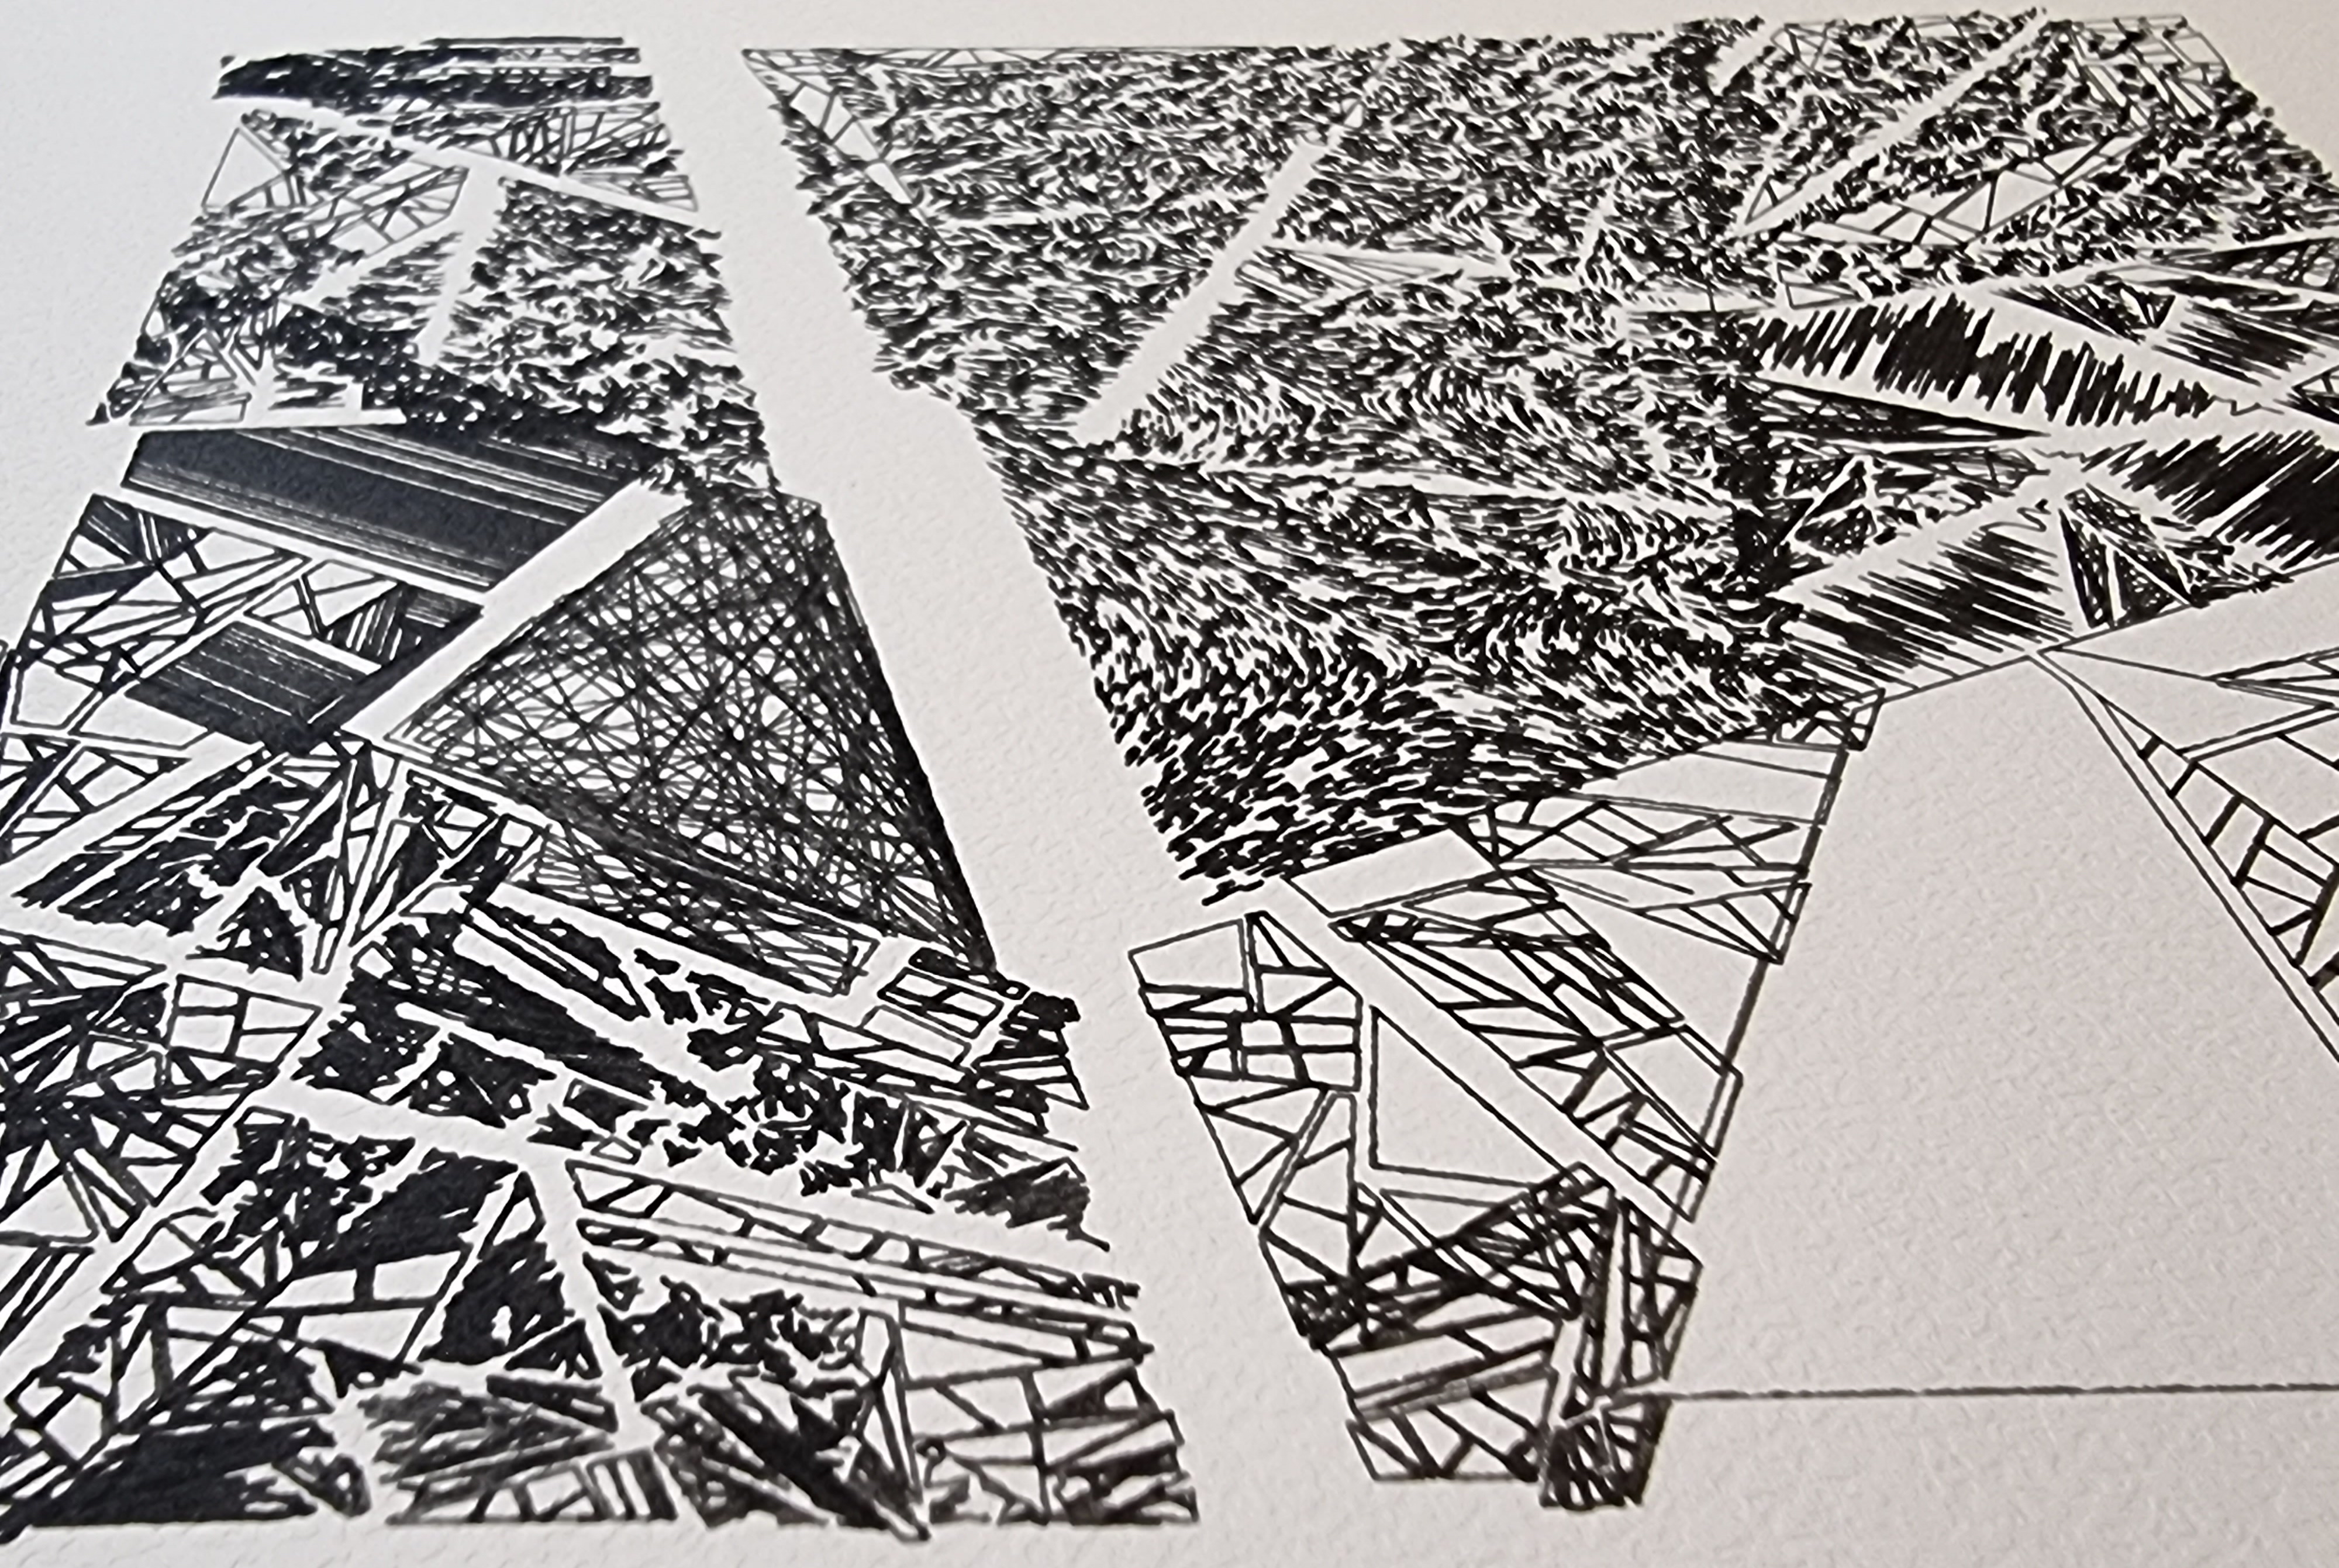
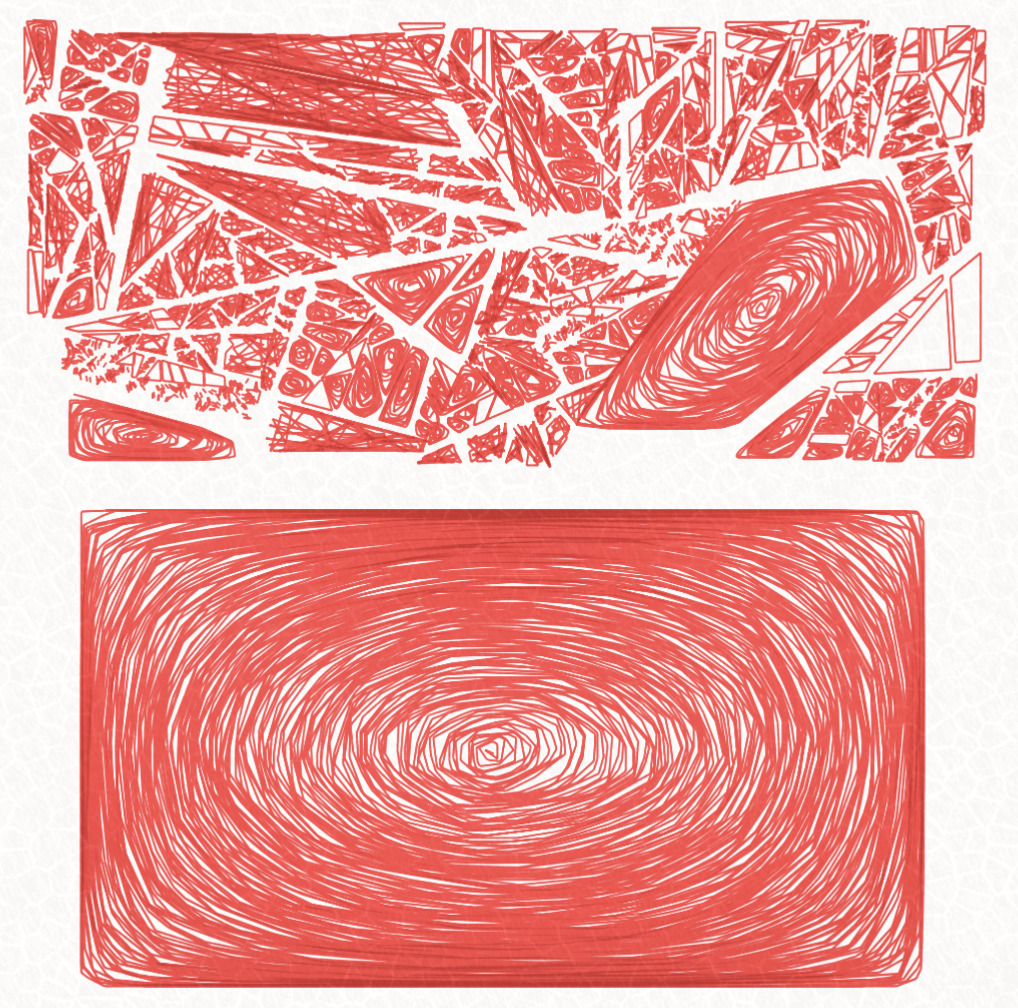
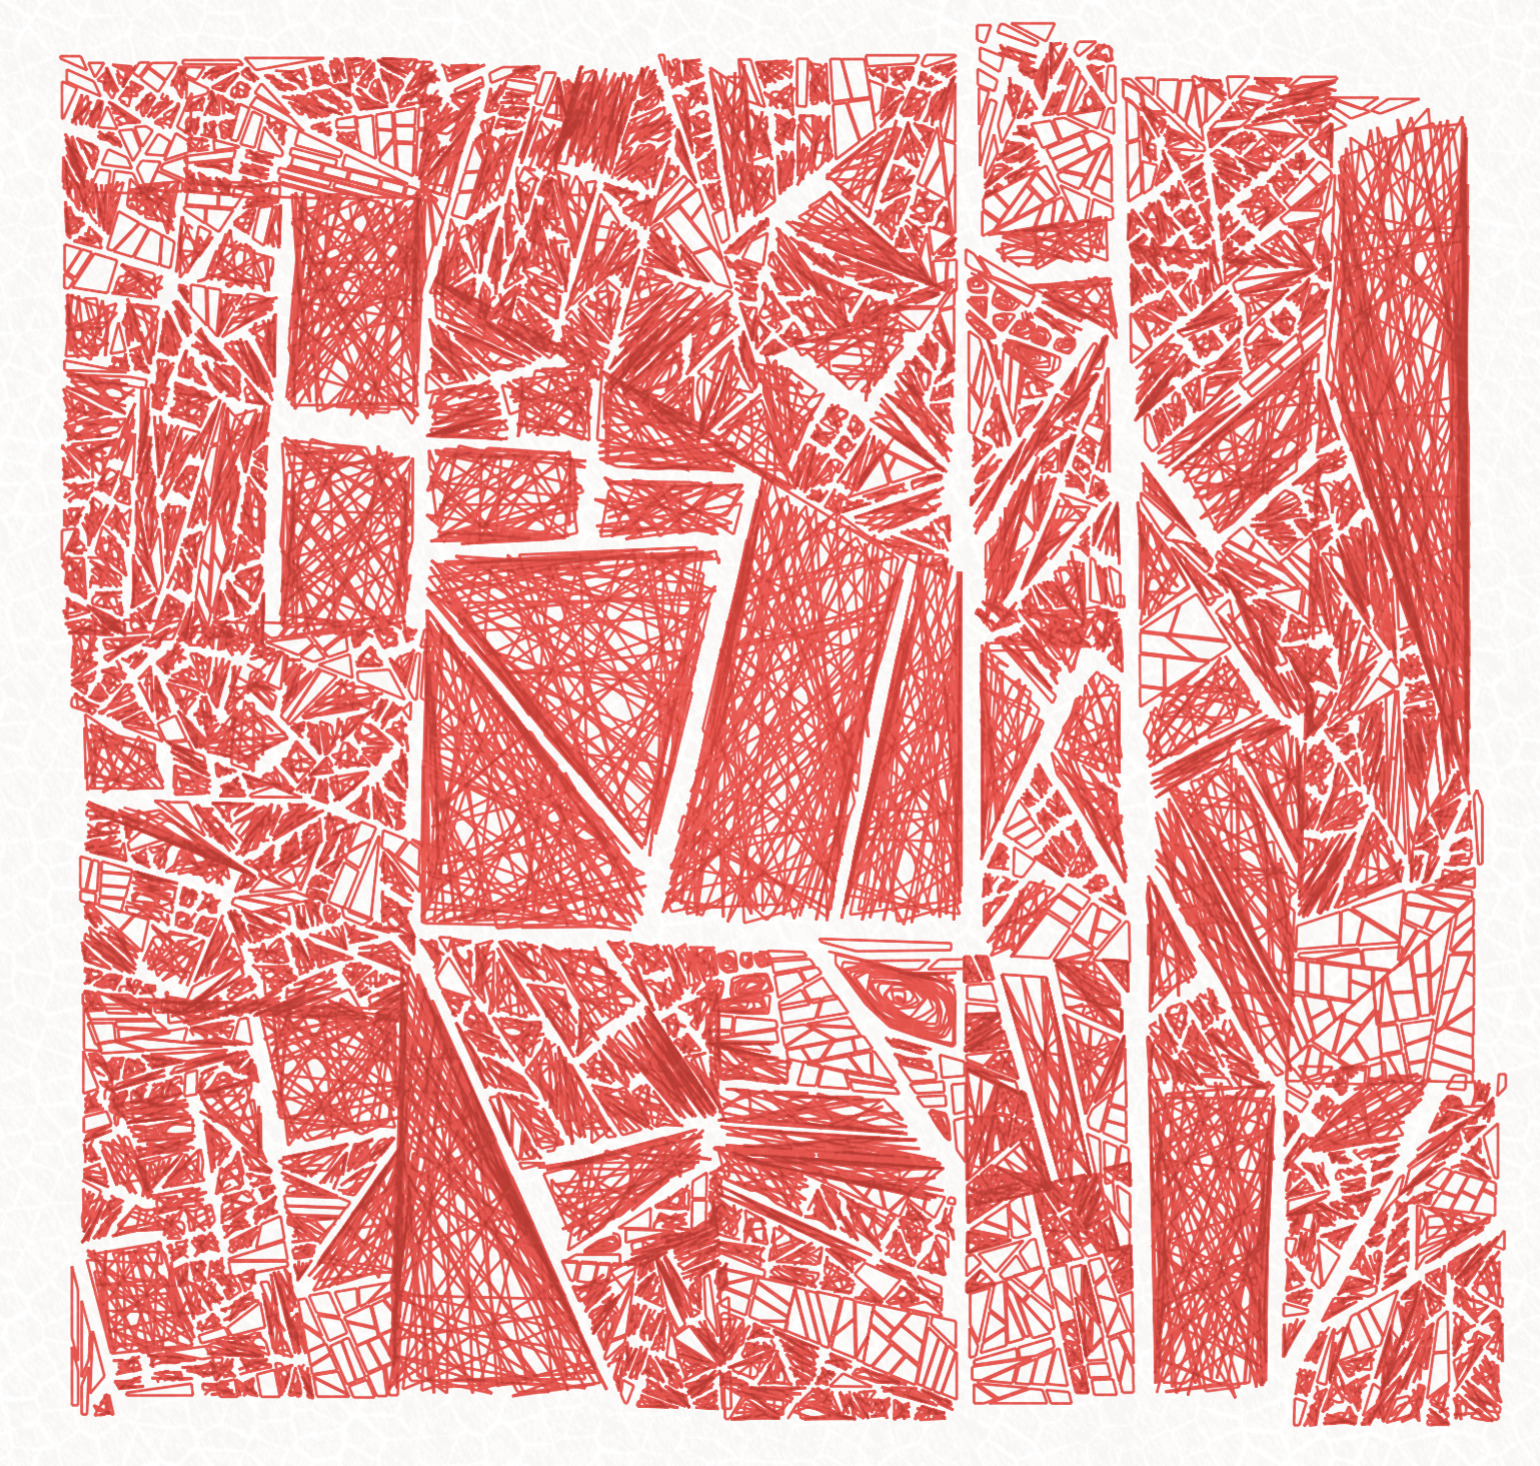
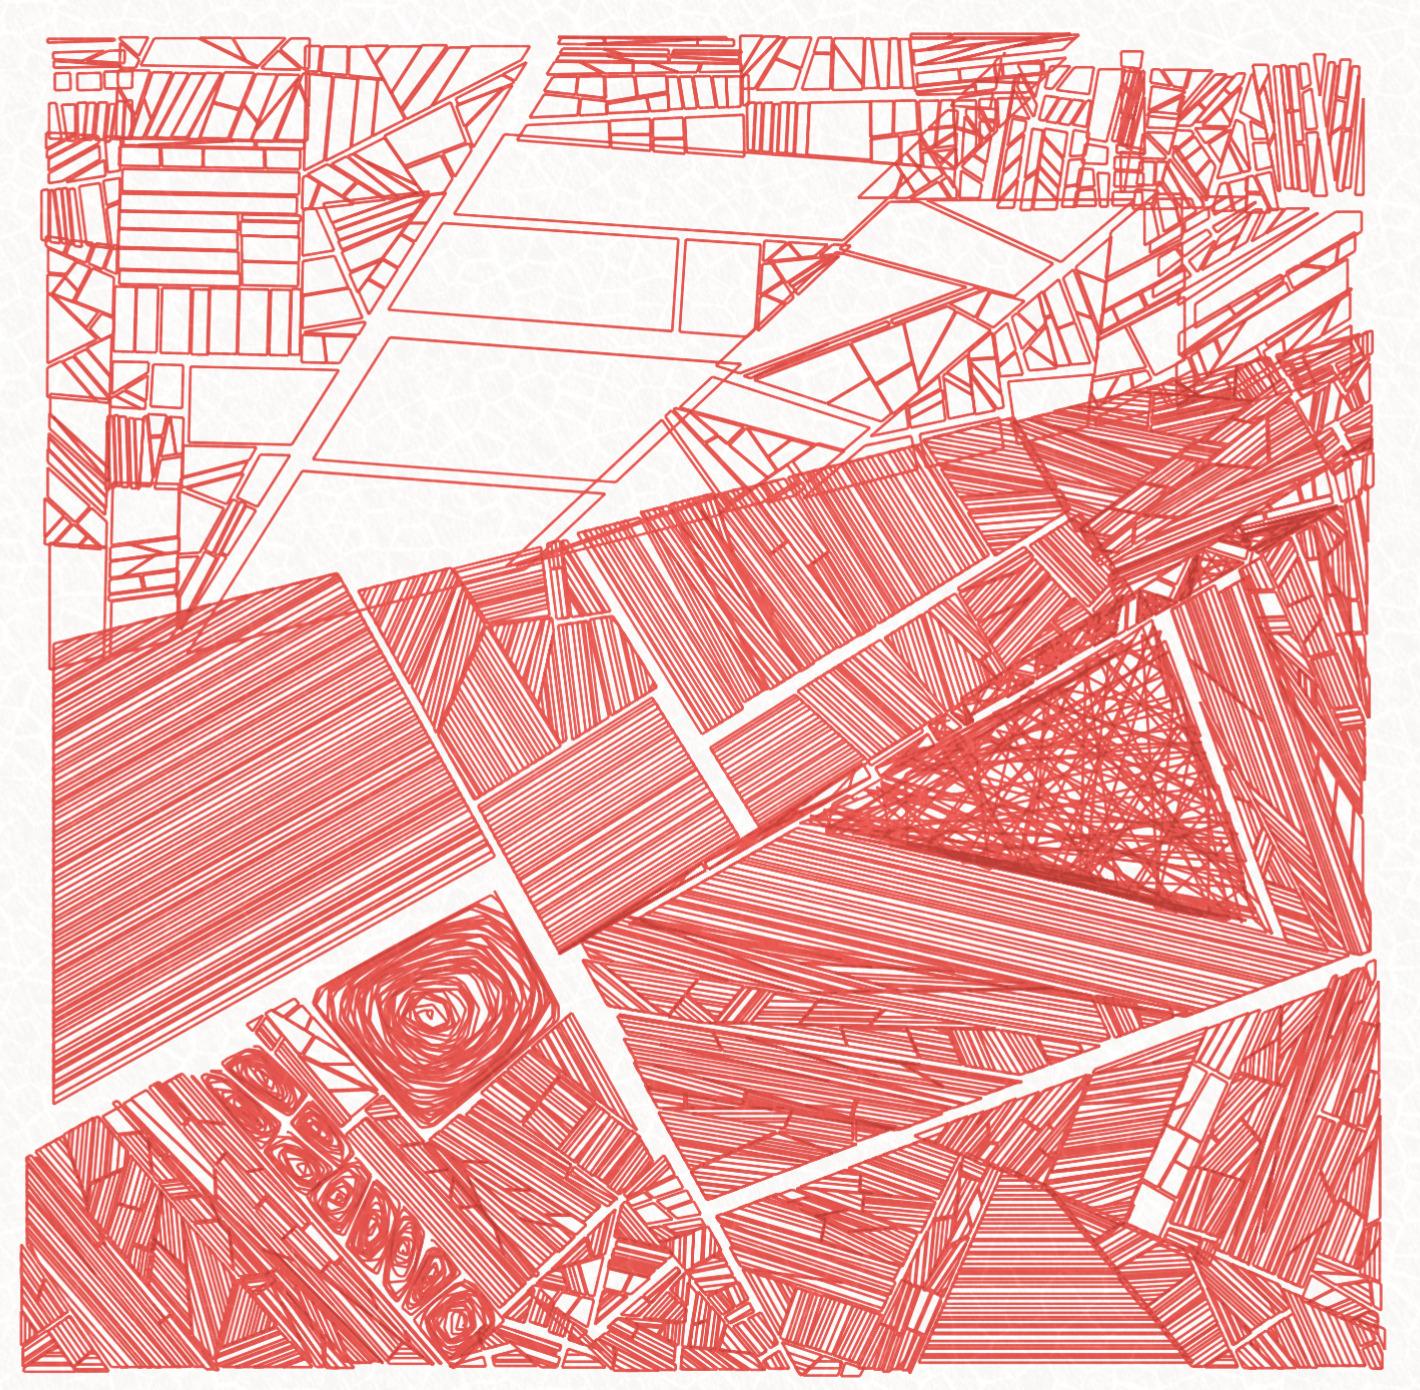
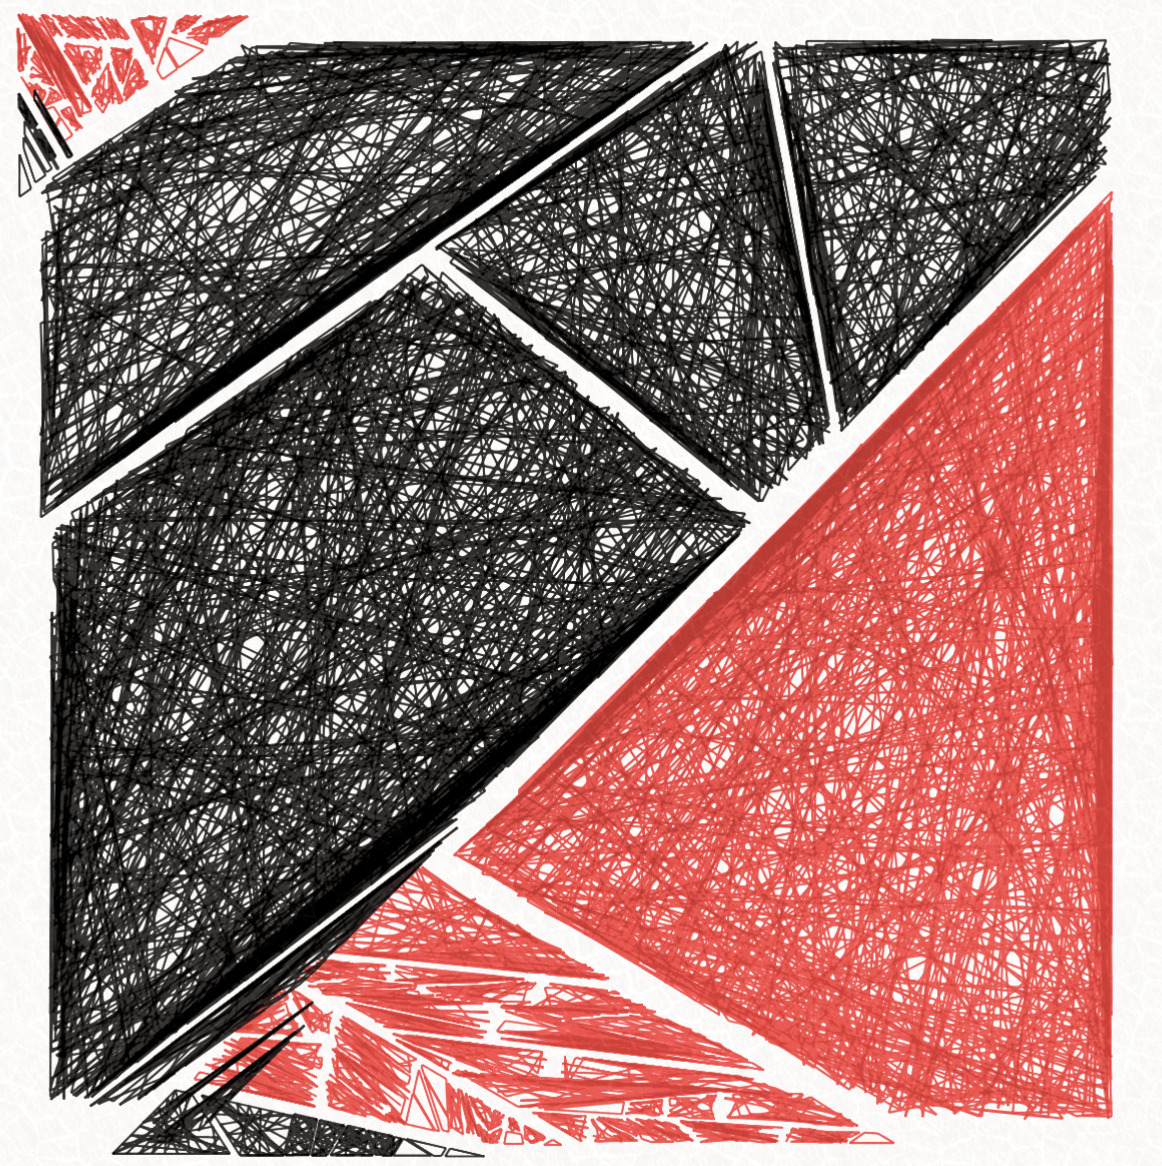
Step 1: the shattering
The "shattering" is implemented with a recursive function that, given a polygon, randomly cut it in half and apply the same recursion on each part. The cut happens in many different ways. For instance, there is a chance for the "cut" to be aligned with the polygon. The recursion can also randomly stop, which can sometimes keep great parts intact. There is even a very small chance (~0.3%) to not obtain a cut at all and have the original polygon preserved. Parts are usually split near their center and the 2 parts that result from the cut can diverge from each other – this simulates some kind of "pushback" resulting of the shattering.
'Shape' feature
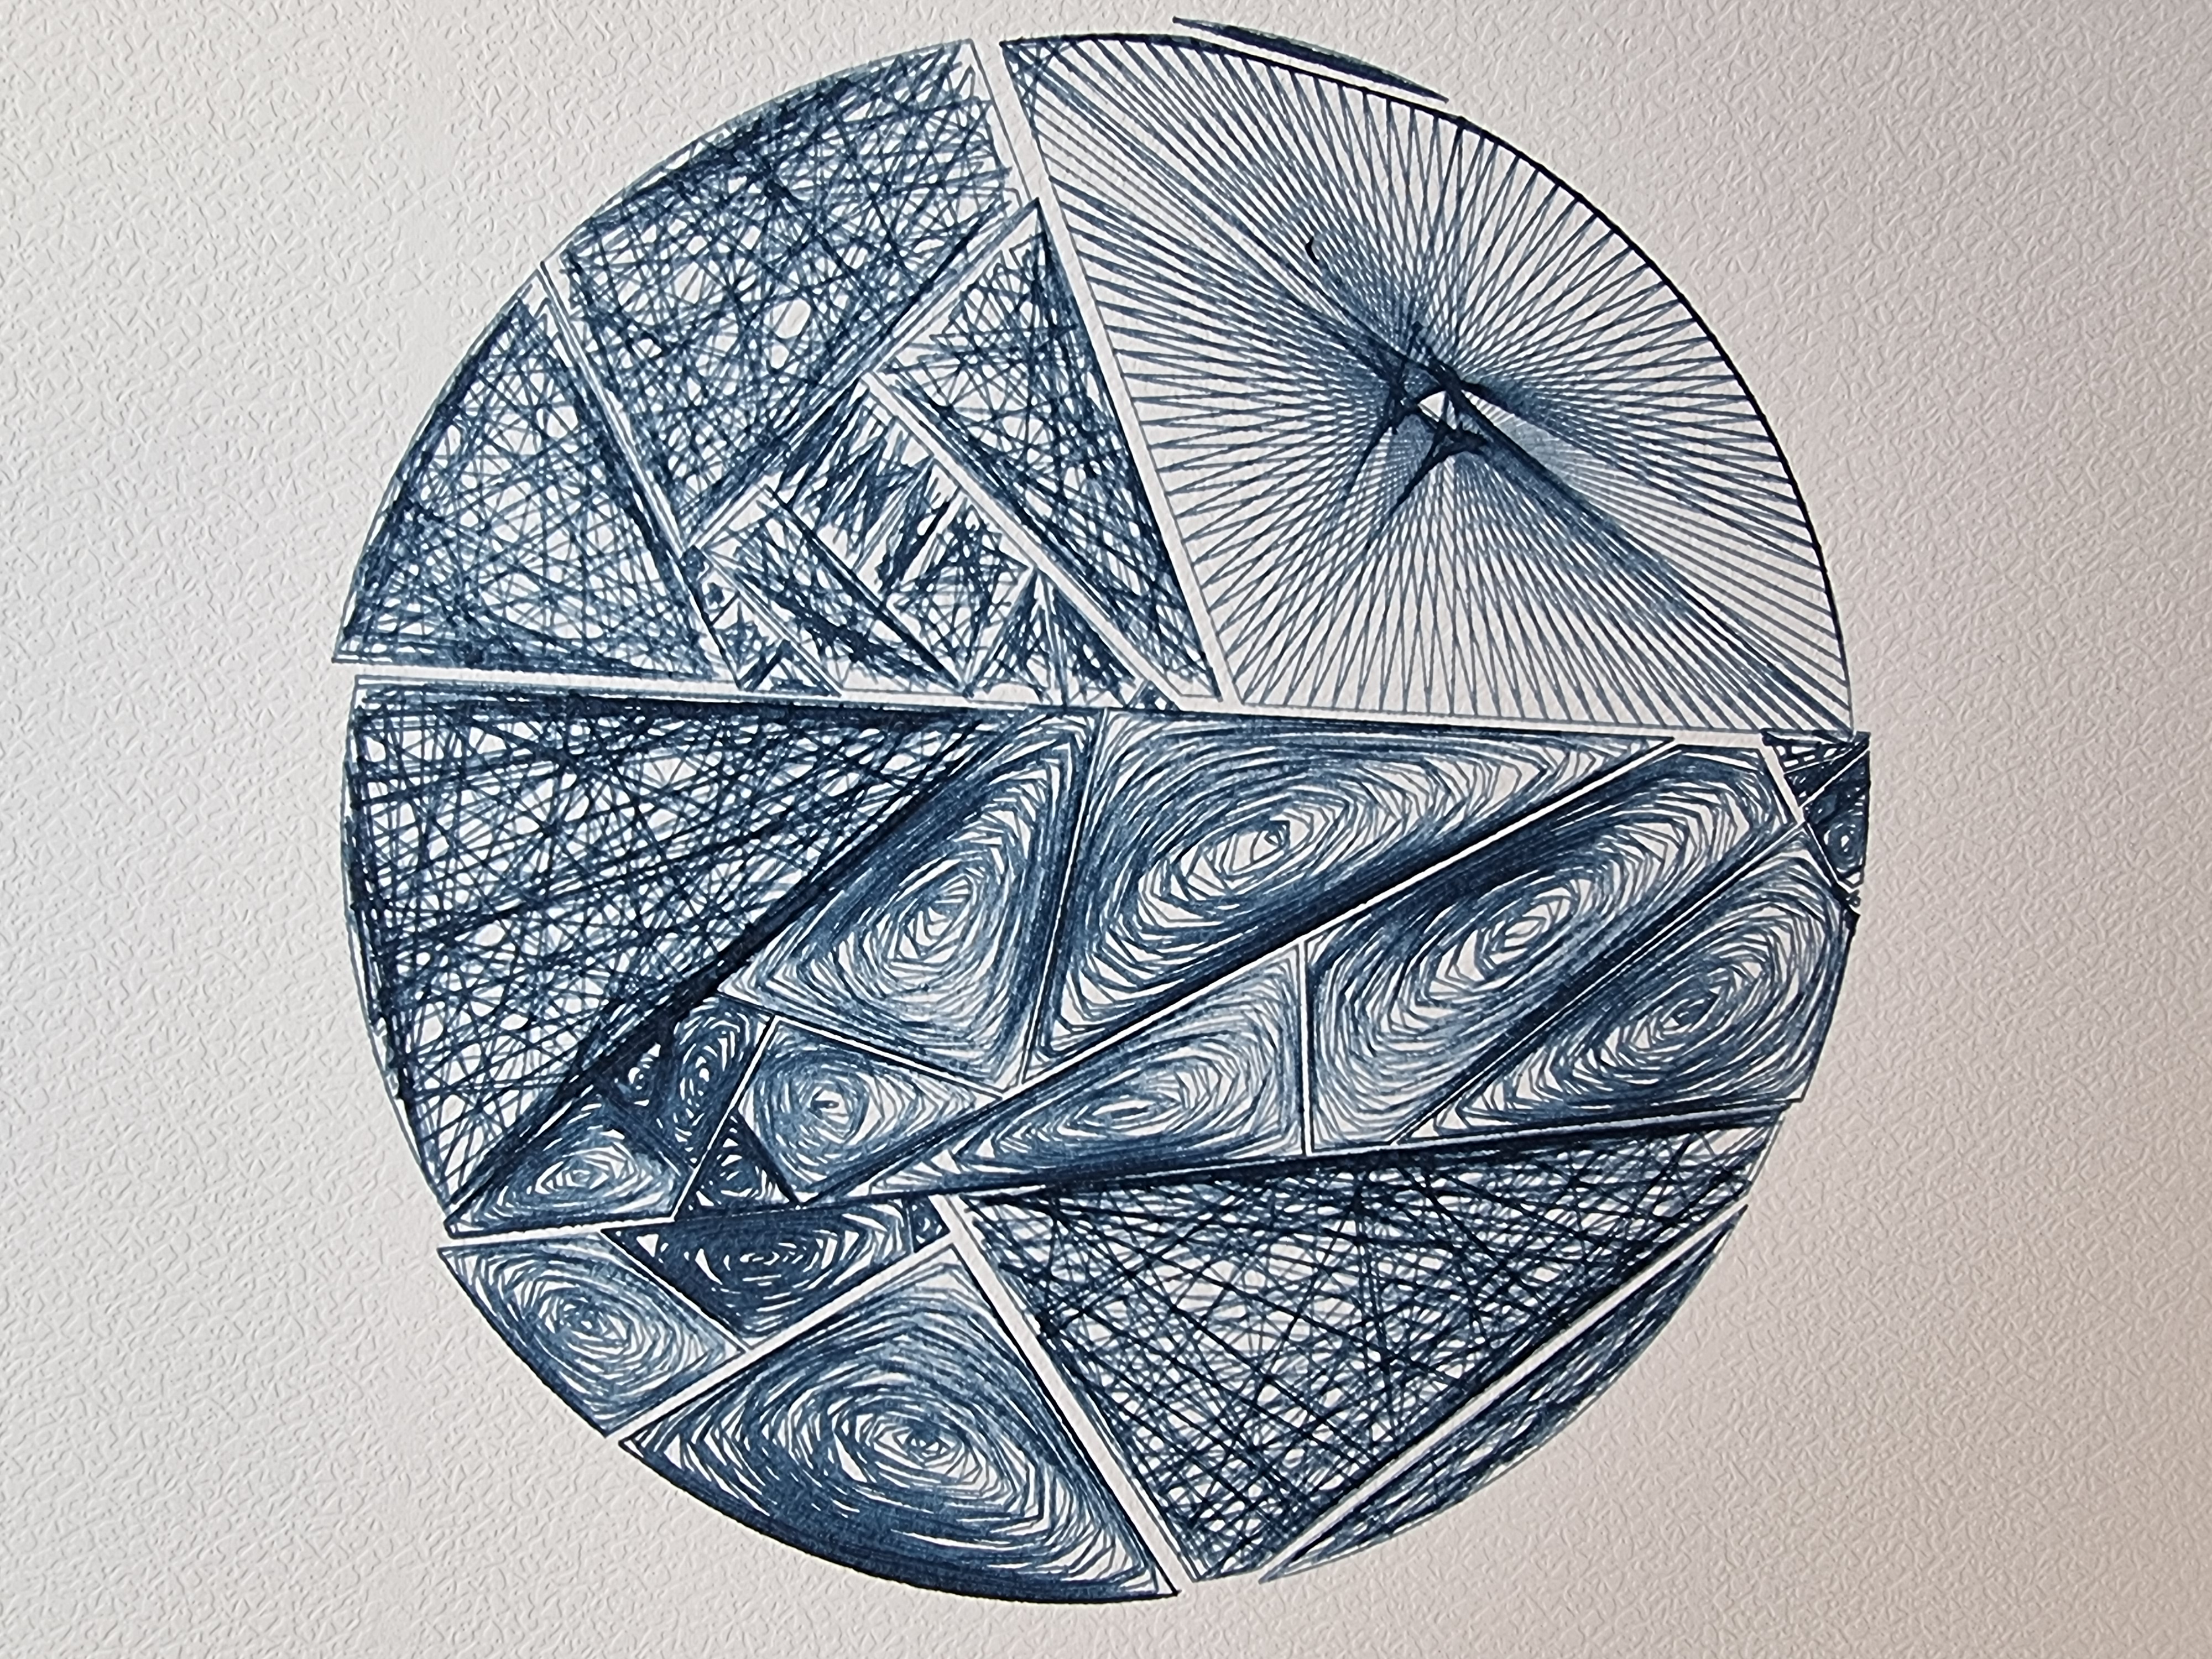
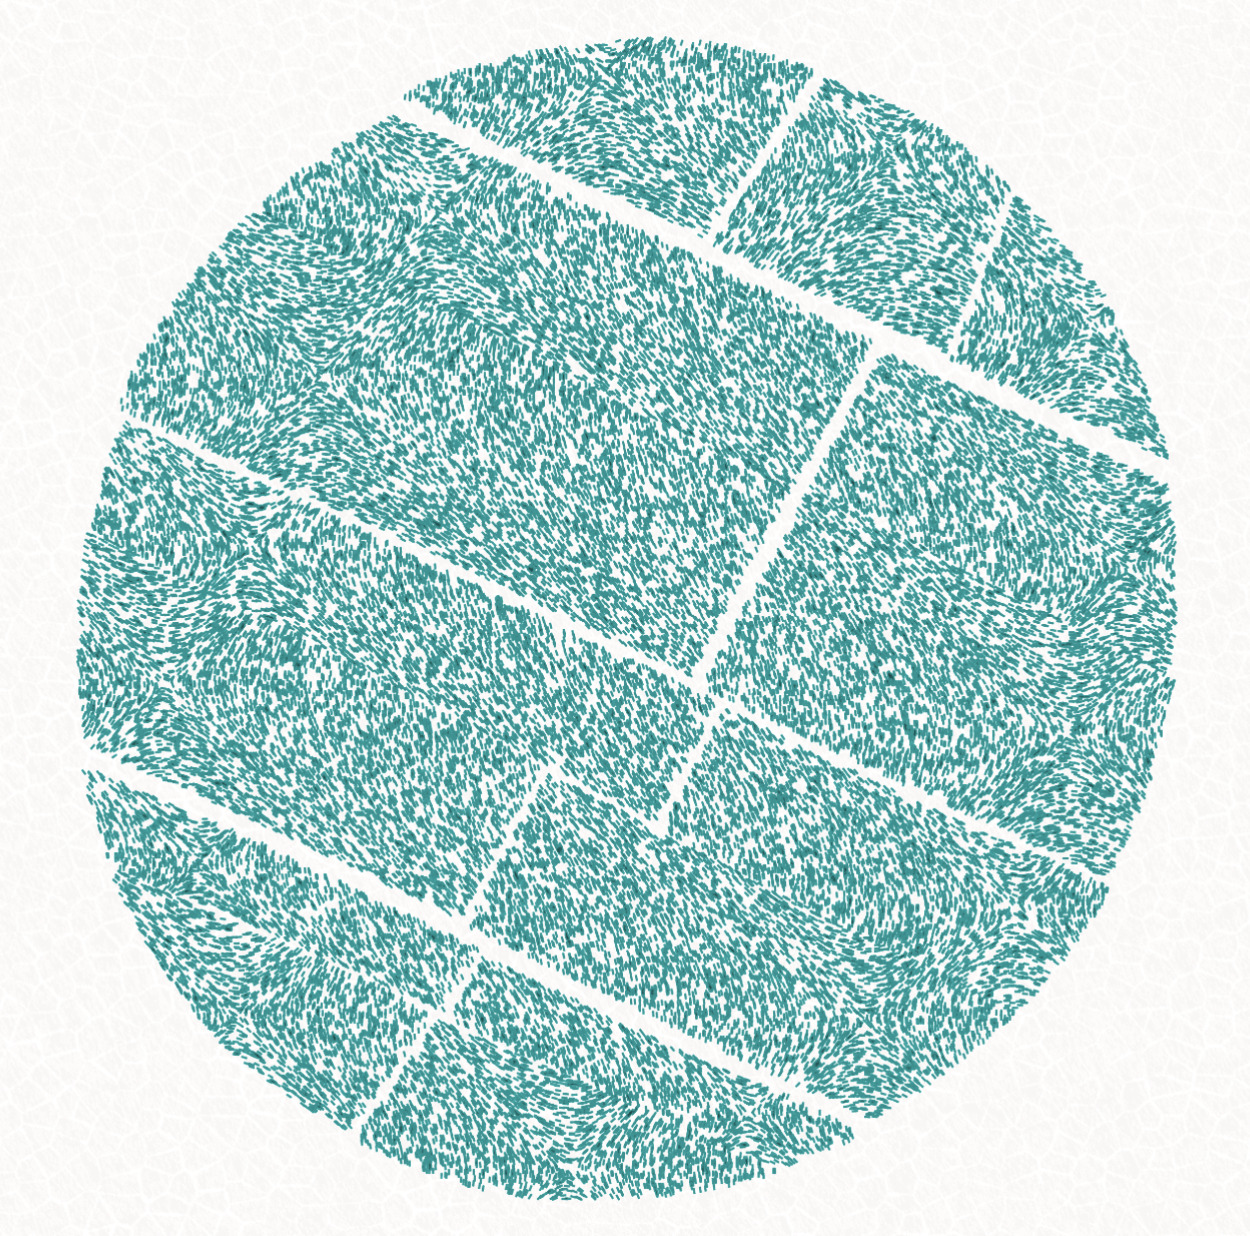
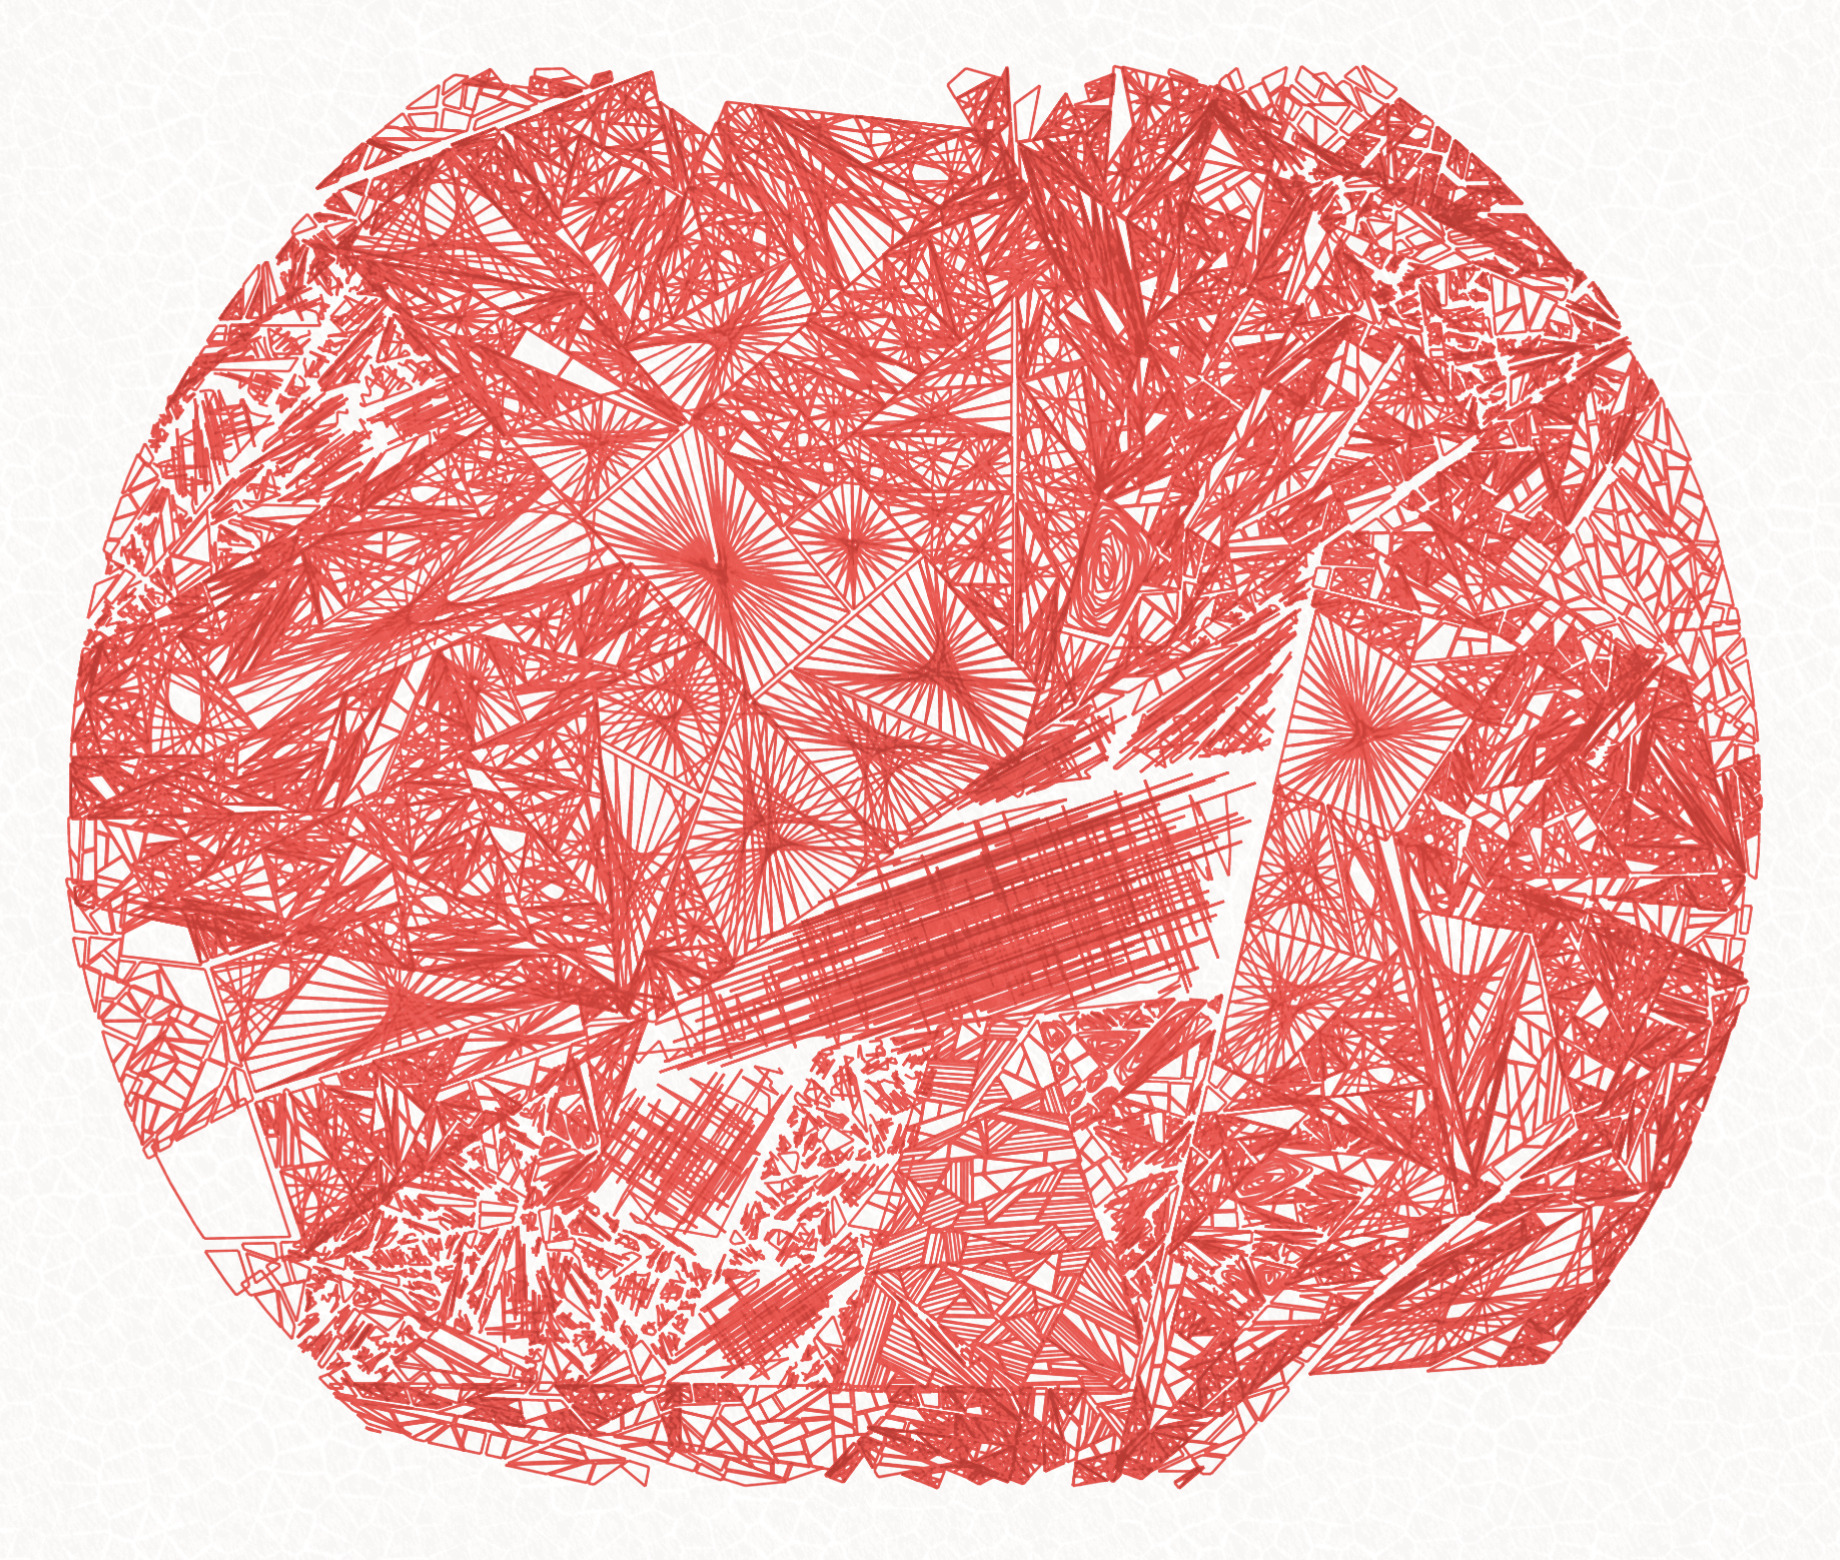
The main polygon used before the shattering occurs can vary from a square to a circle, with rare cases of triangles, hexagons,...
Square remains the most common shape to have.
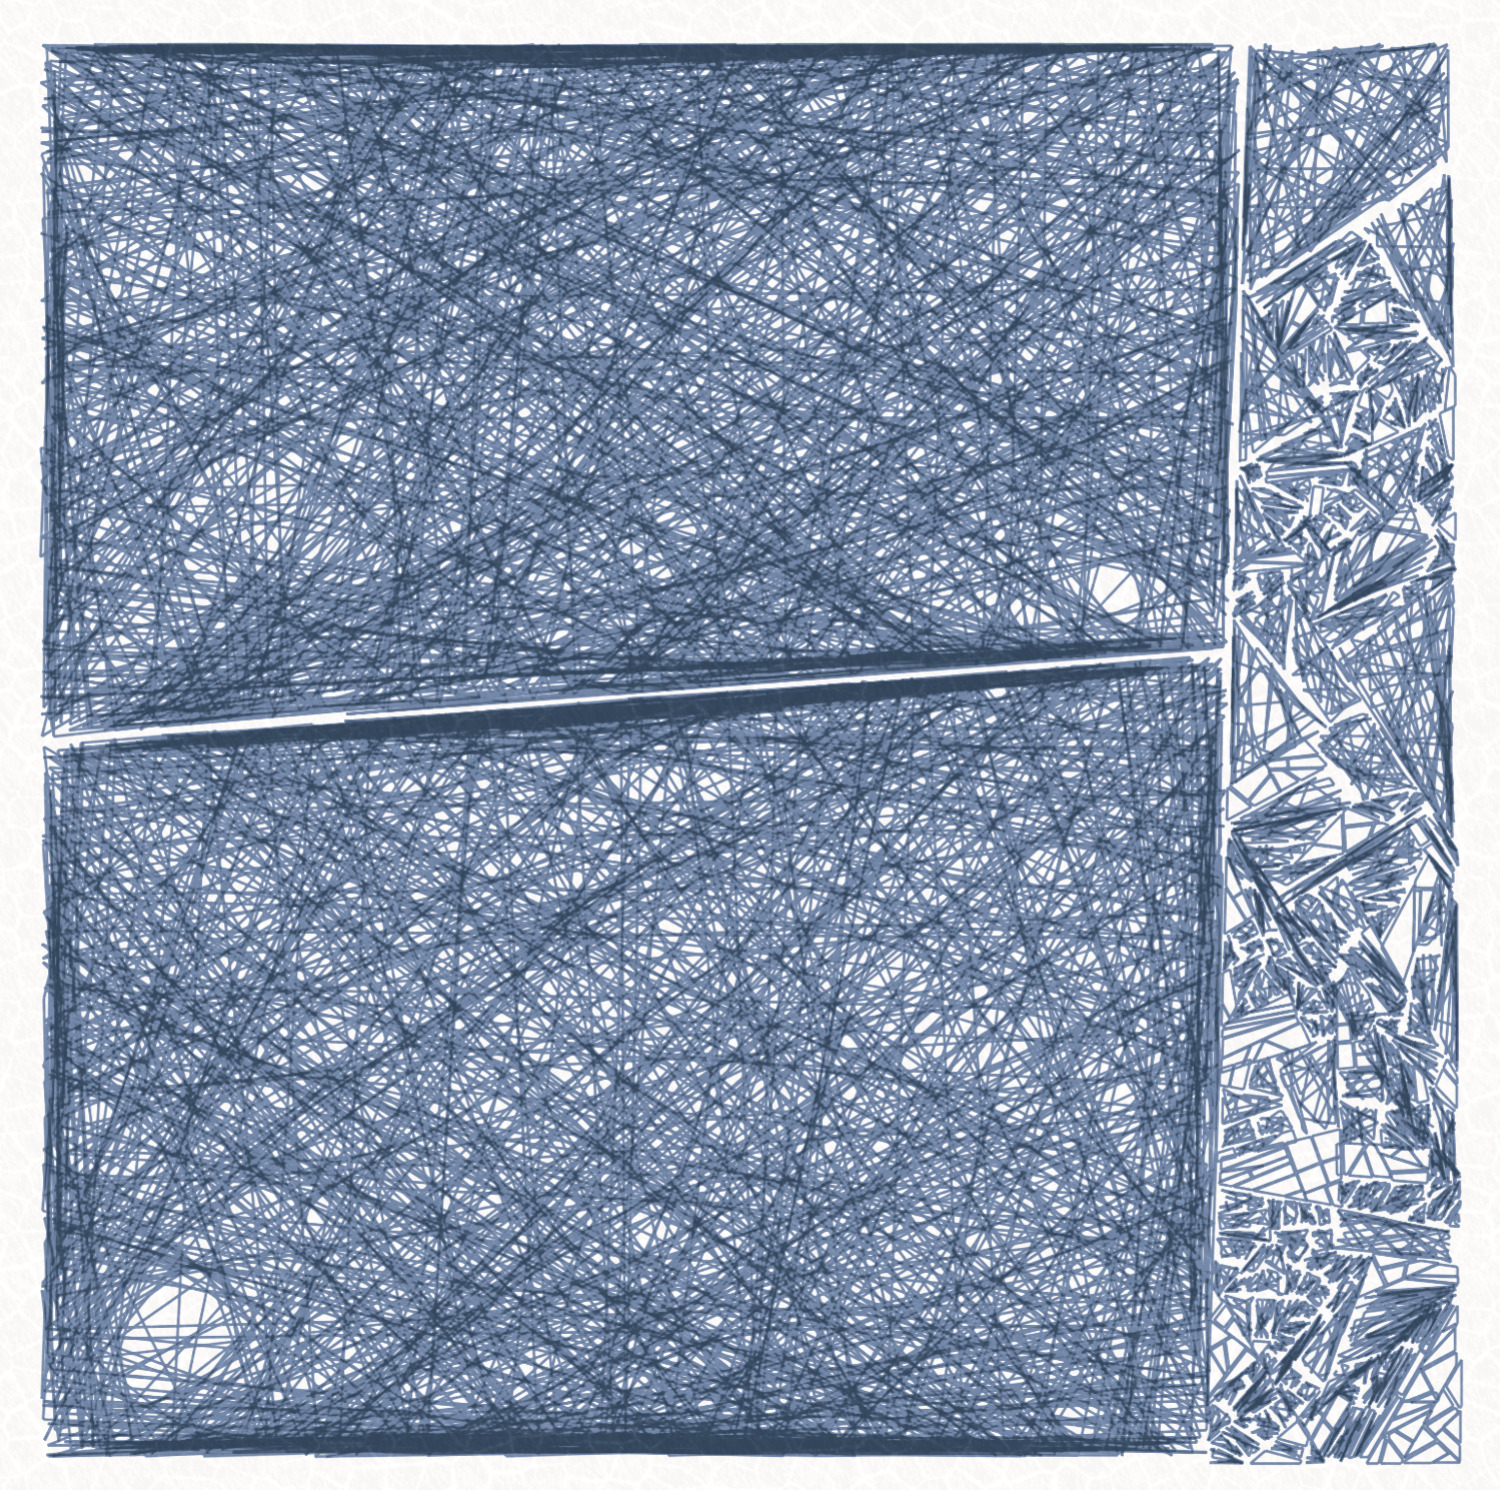
'Parts' feature
This feature categorizes the number of polygon parts that result from the shattering. It can vary from one to thousands.
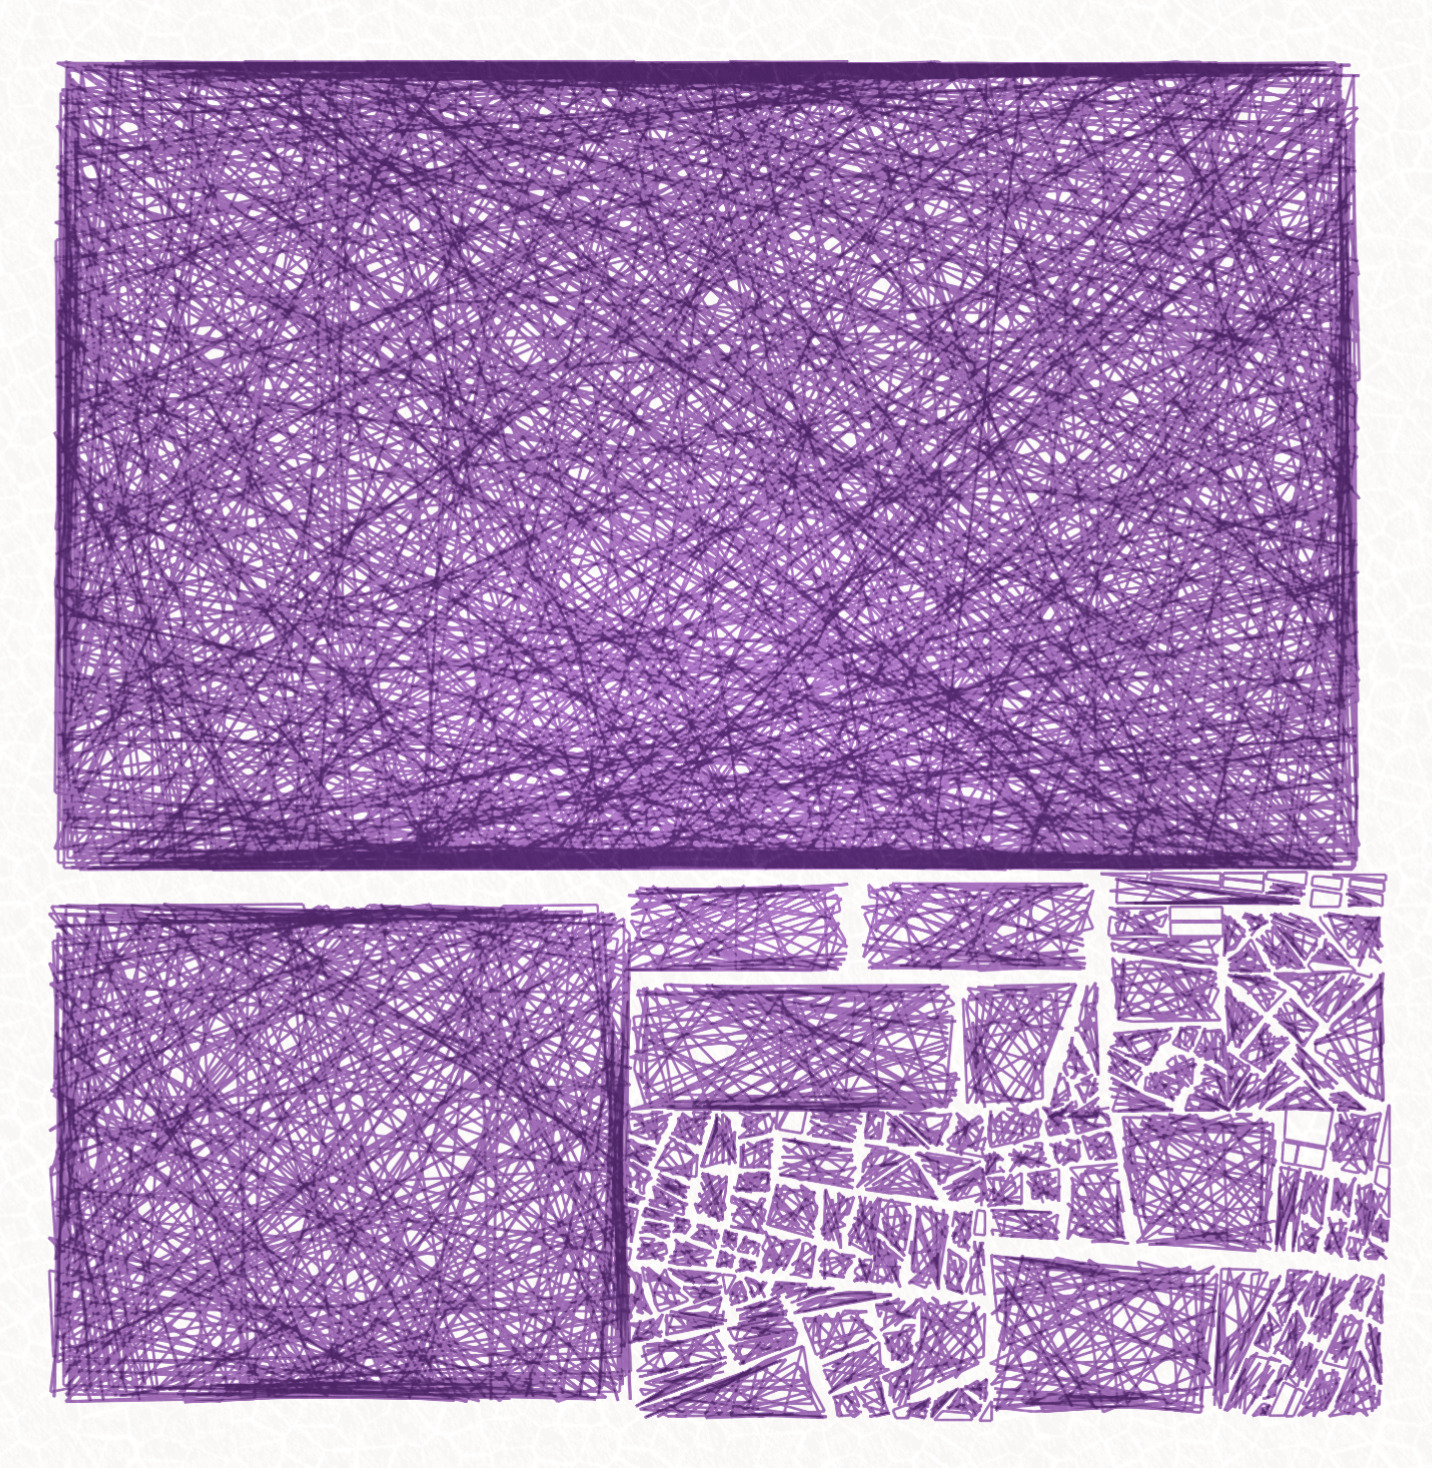
'Pushback' feature
This feature expresses how intense the Pushback is for a given piece – effect that shifts parts away from each other.
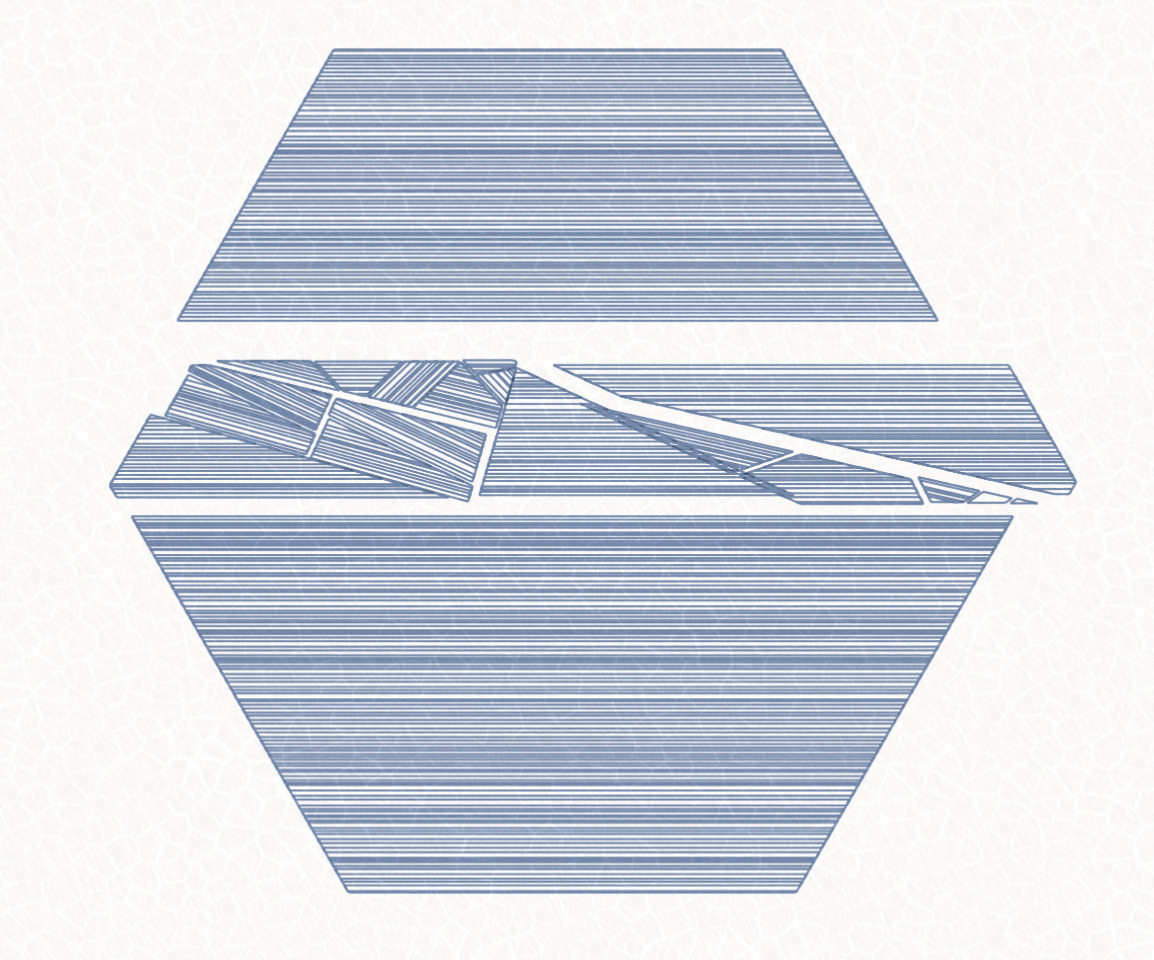
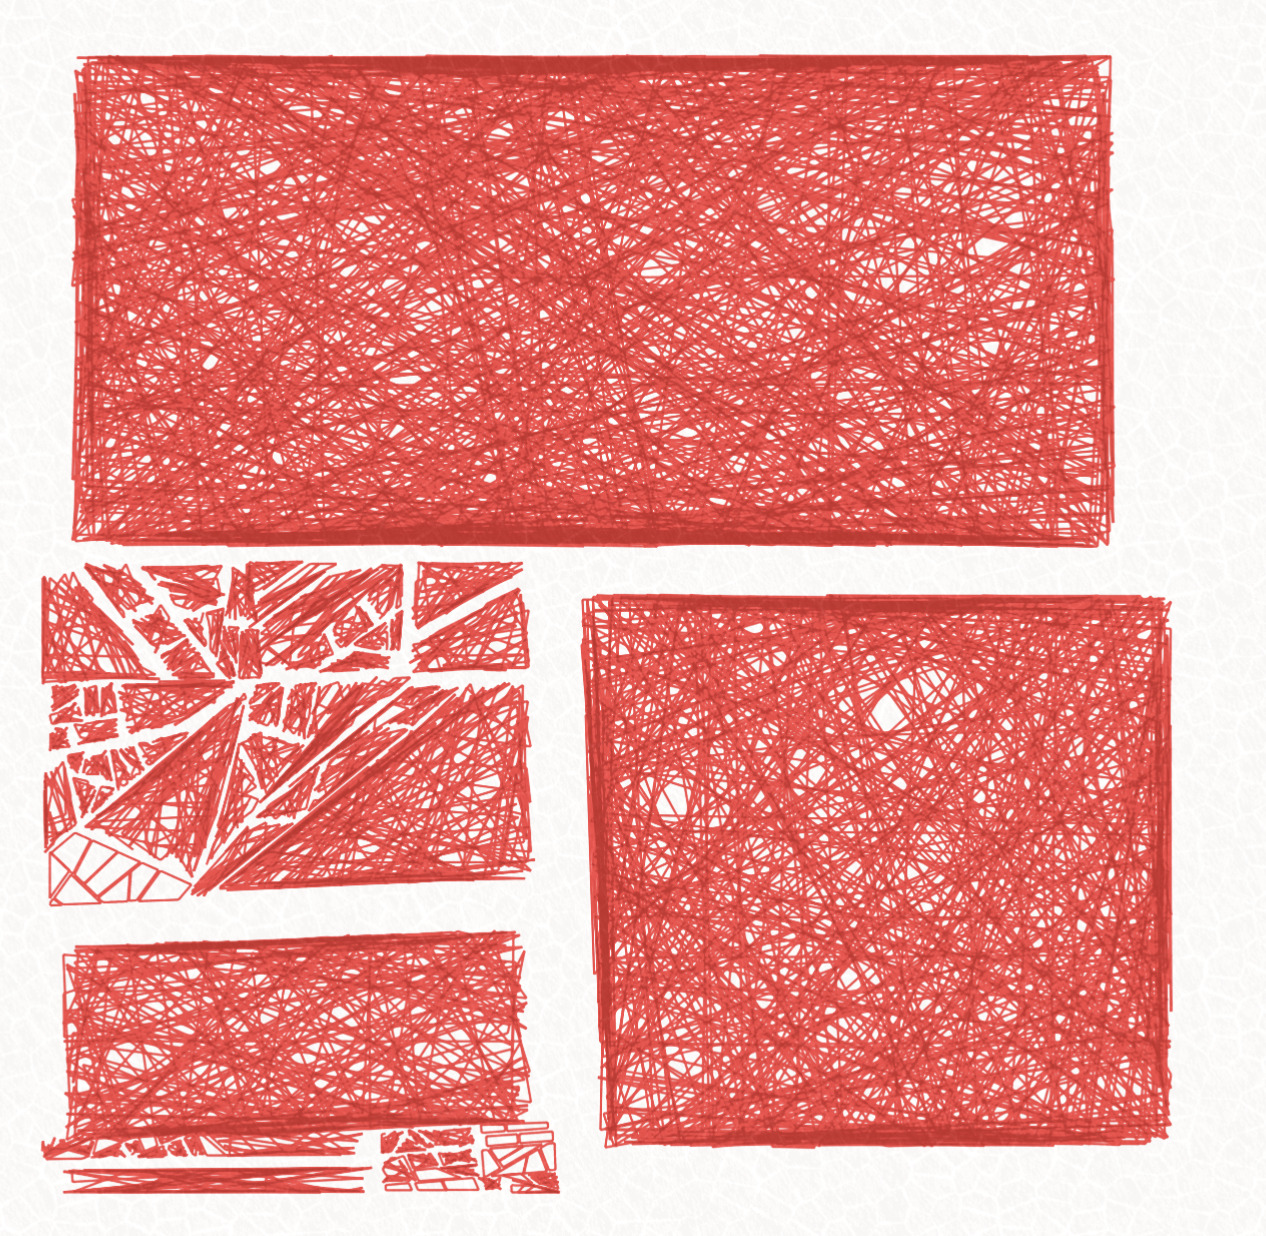
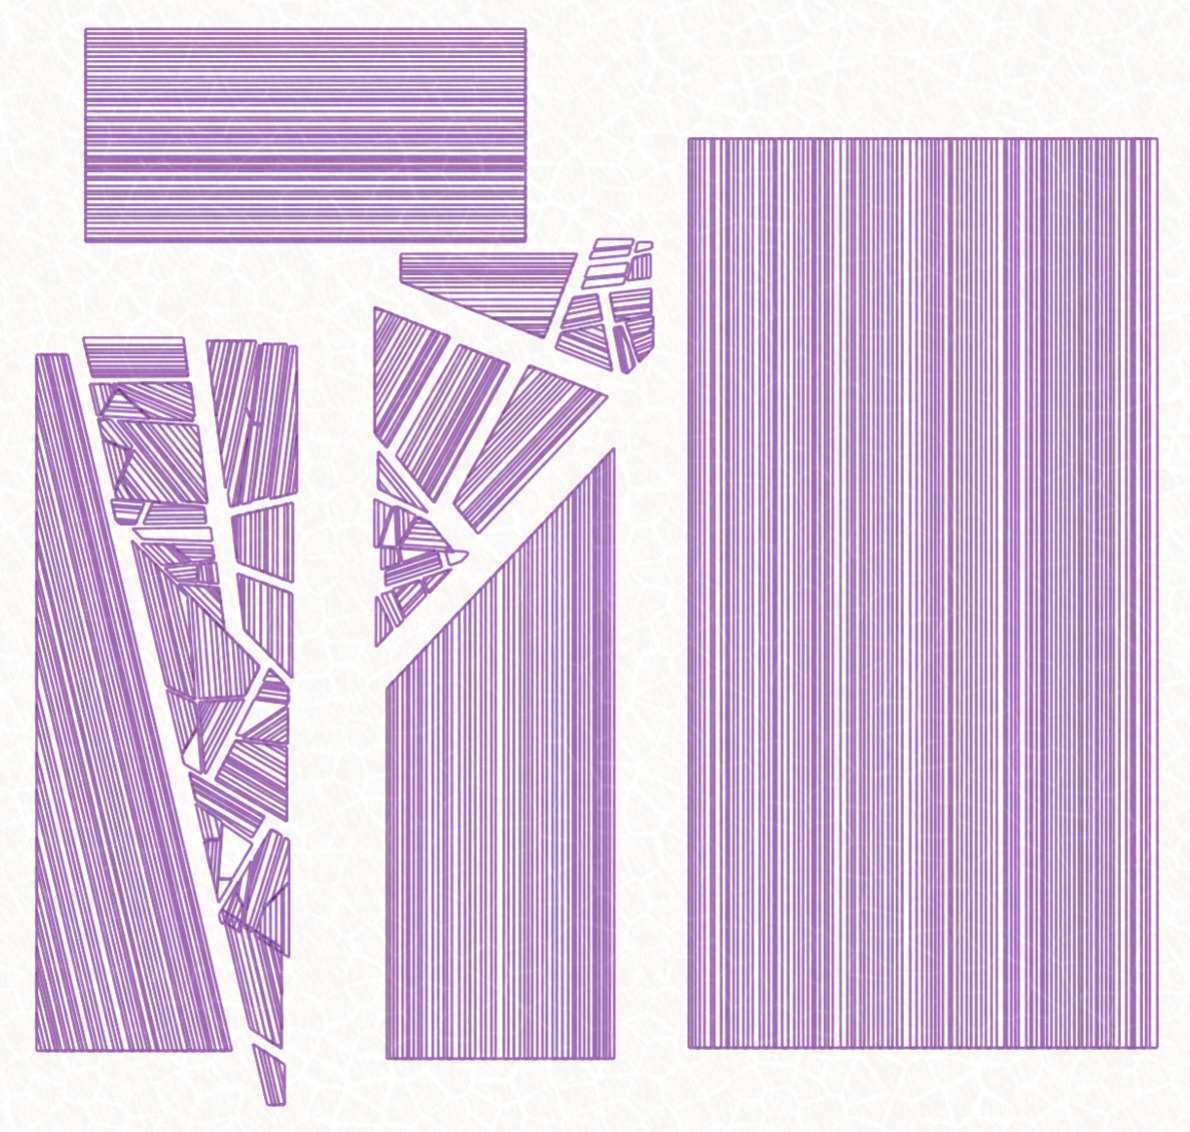
It can sometimes not exist at all which make the polygon preserving its general shape and only showing subdivisions:
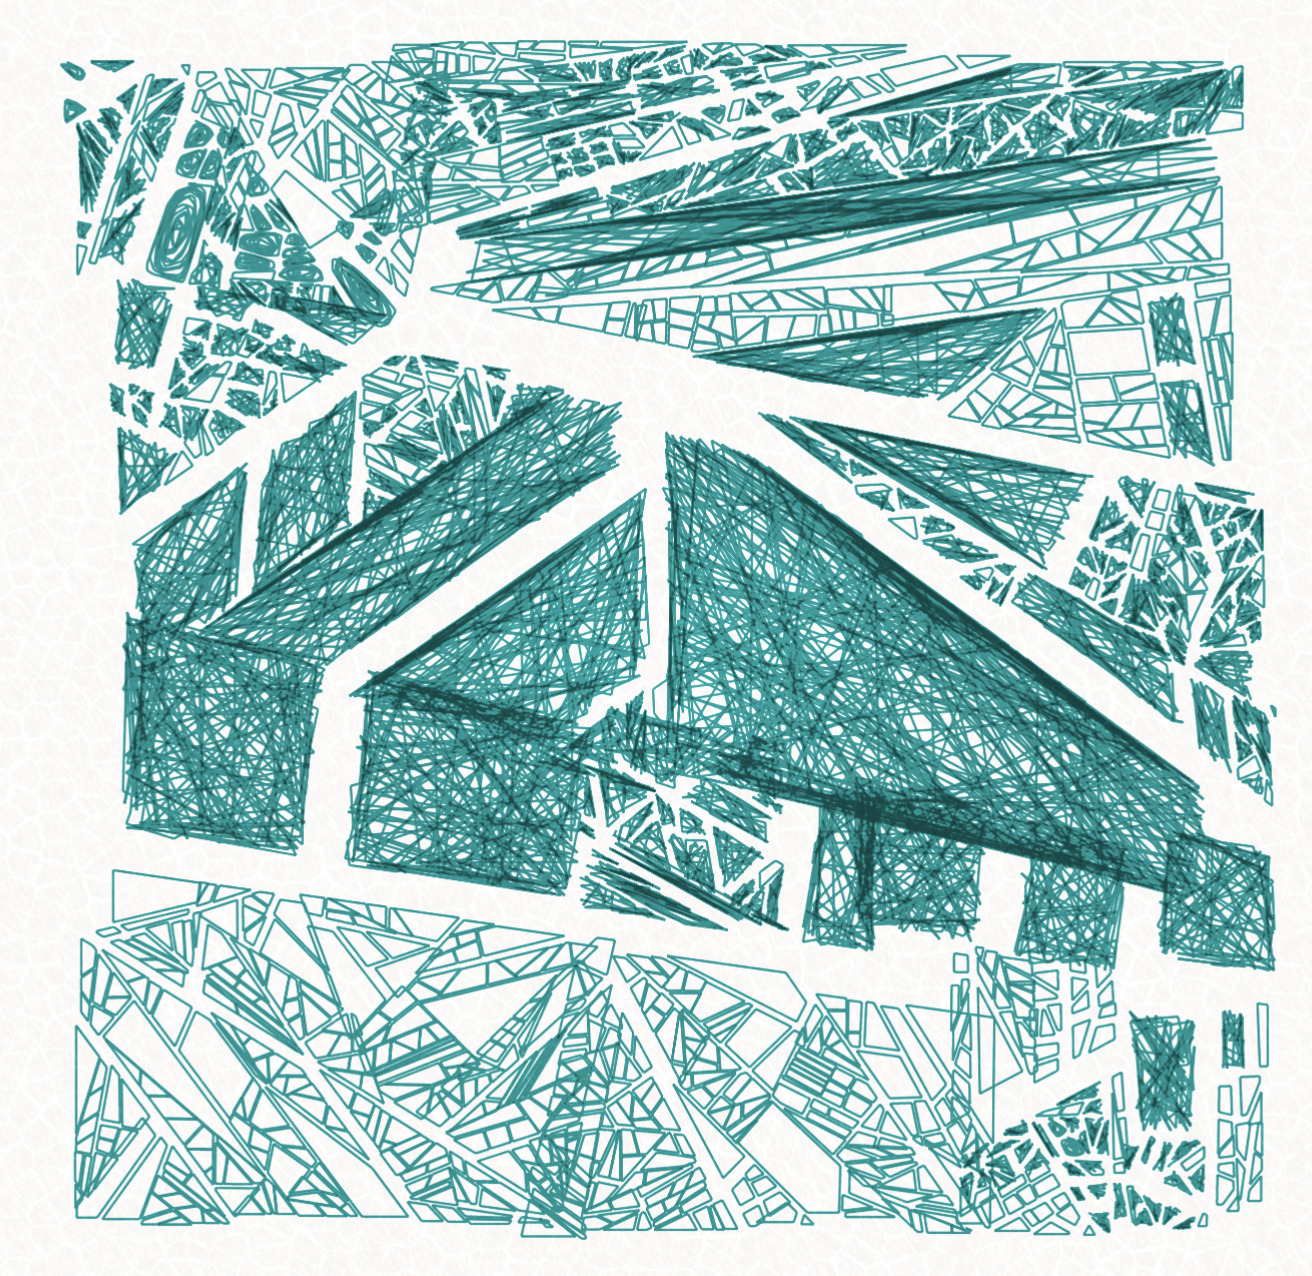
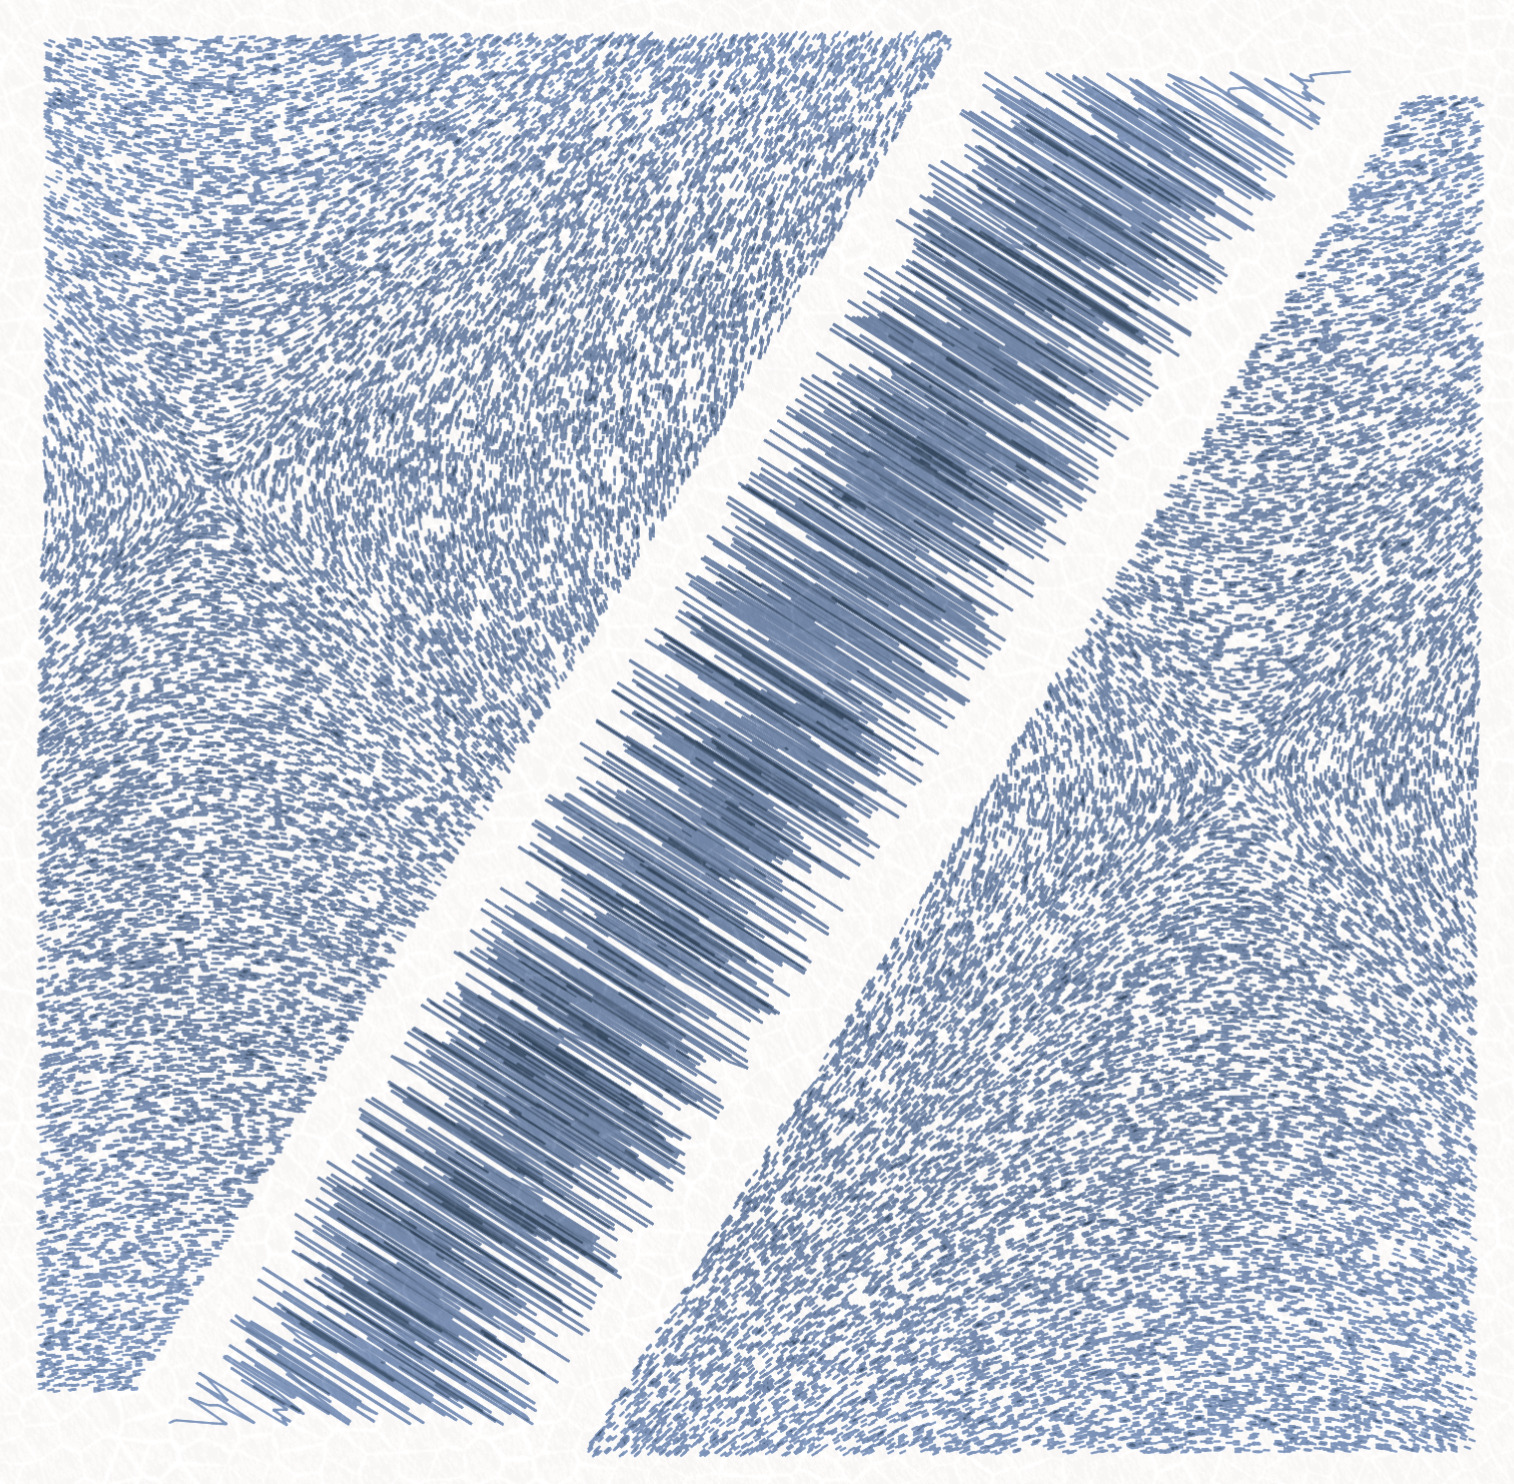
'Alignment' feature
The alignment represents how perpendicular the parts are organized altogether.
This has no alignment:
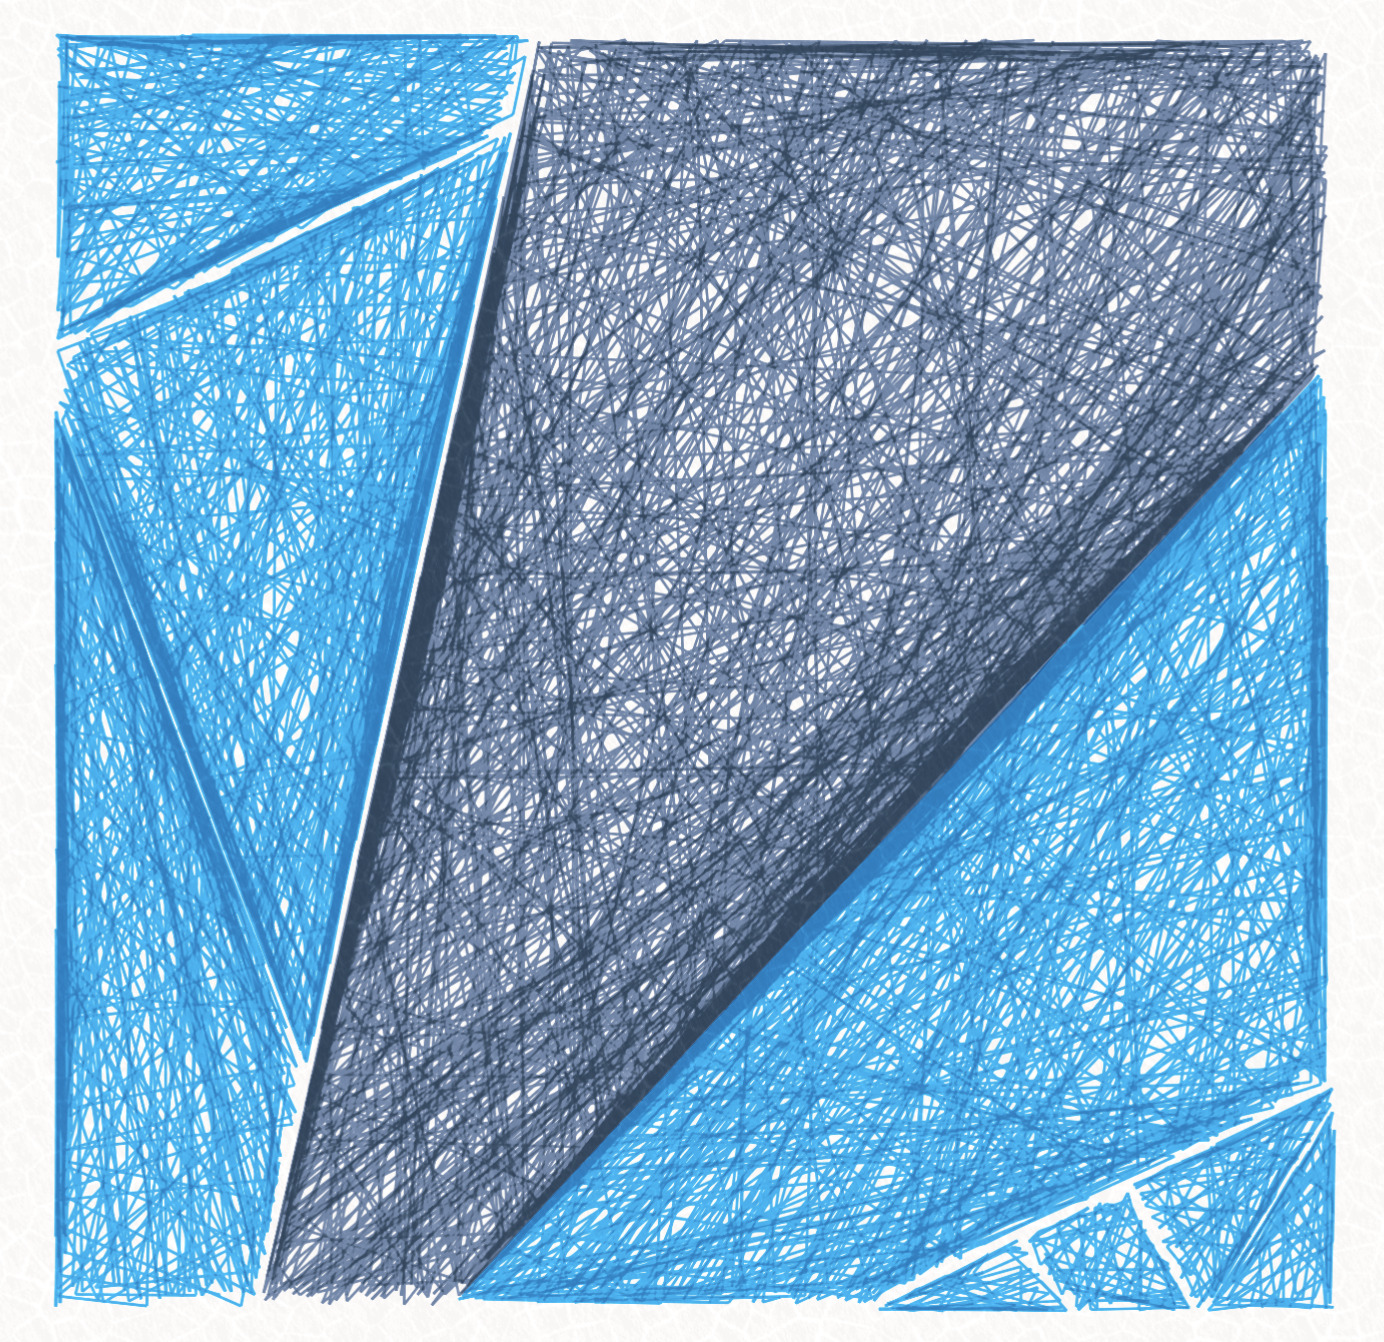
These have the max alignment:
'Destructed' feature
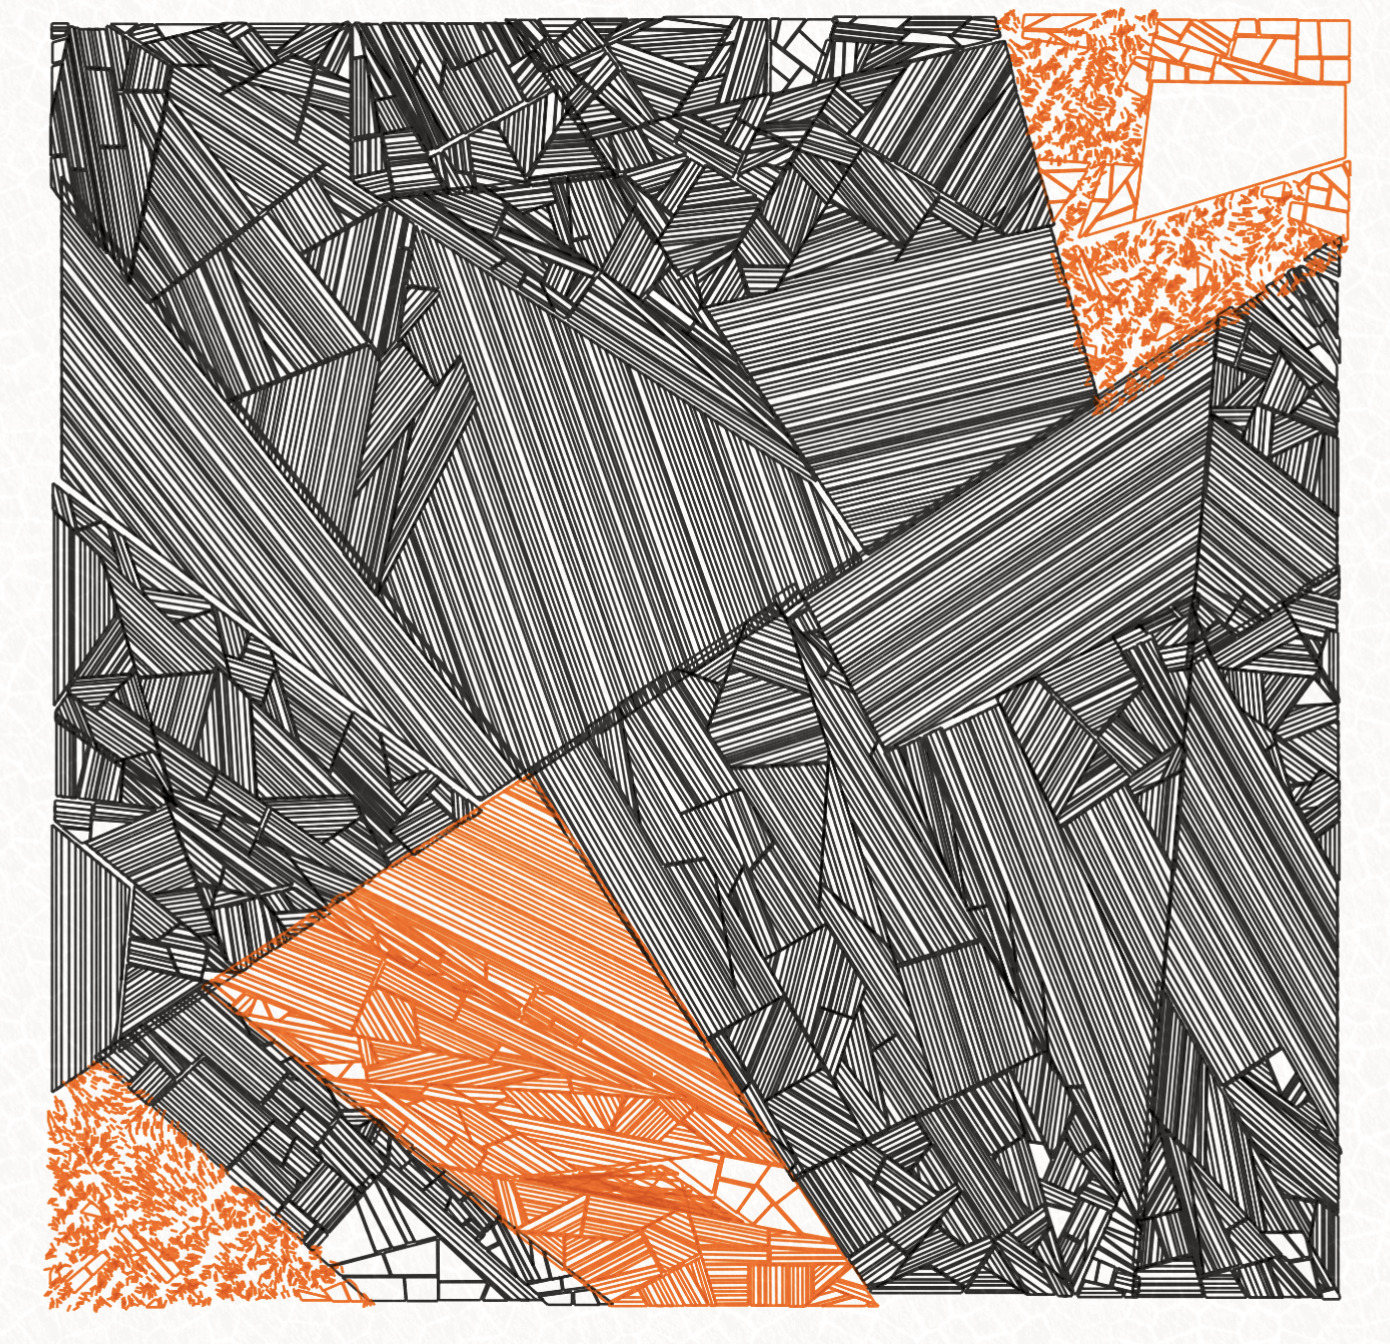
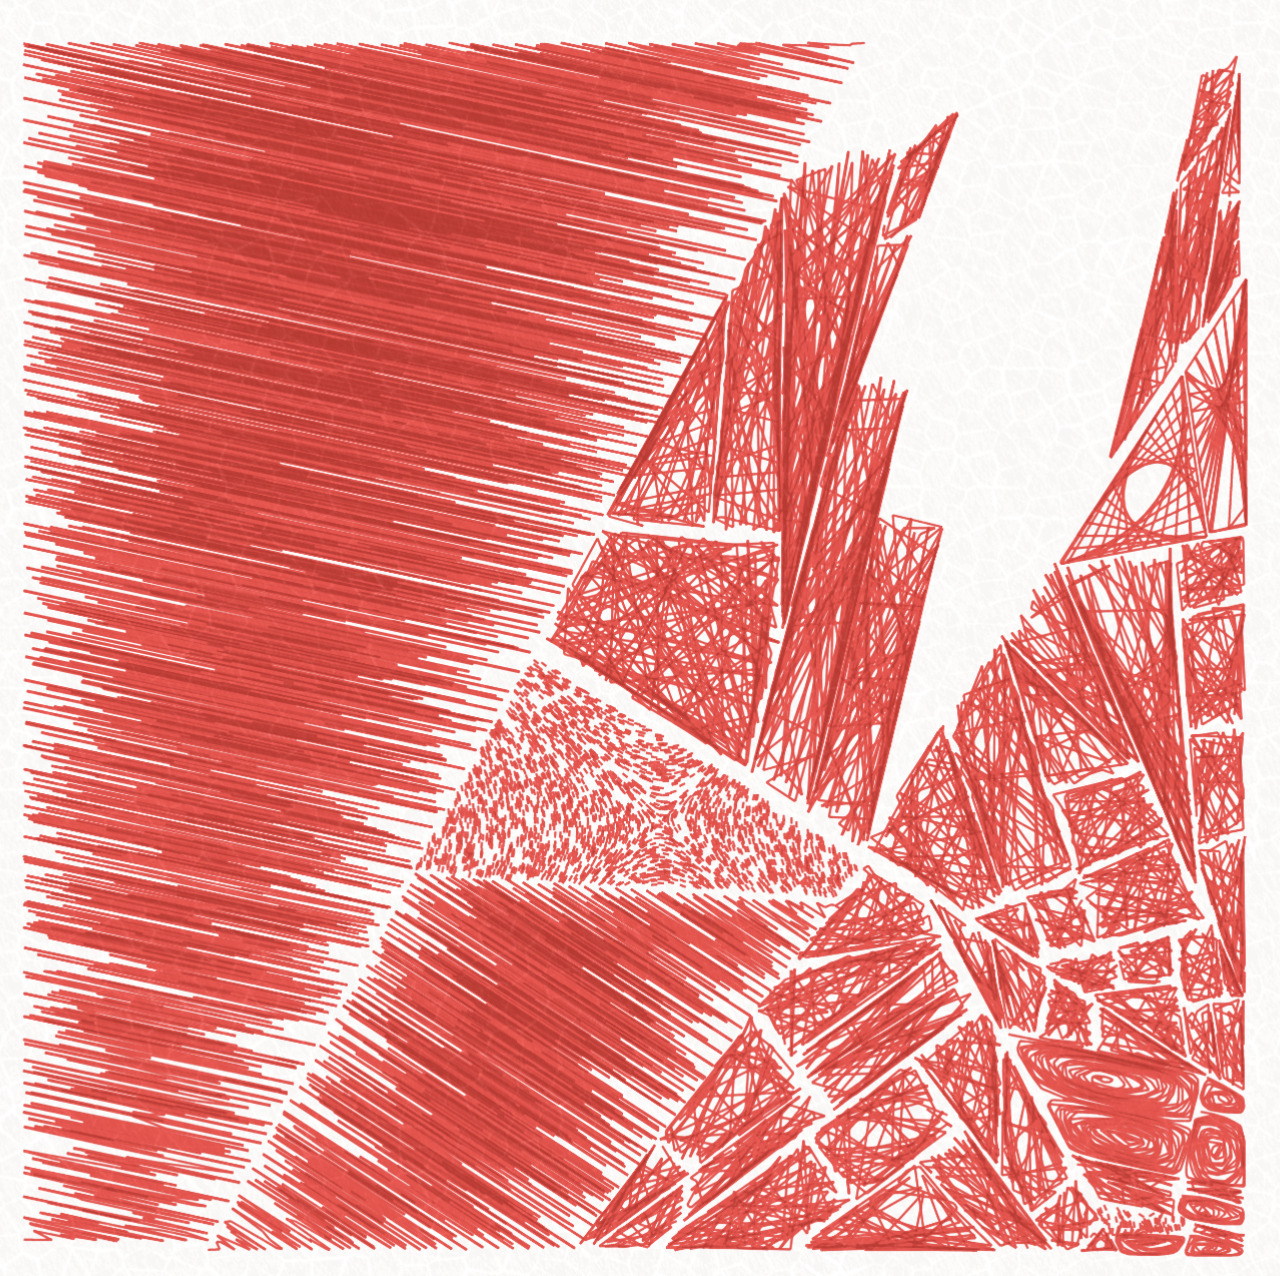
'Destructed' is a rare feature that expresses that part of the polygons has been destructed. This sometimes happens when the shattered parts are pushbacked out of boundaries.
'Distribution' feature
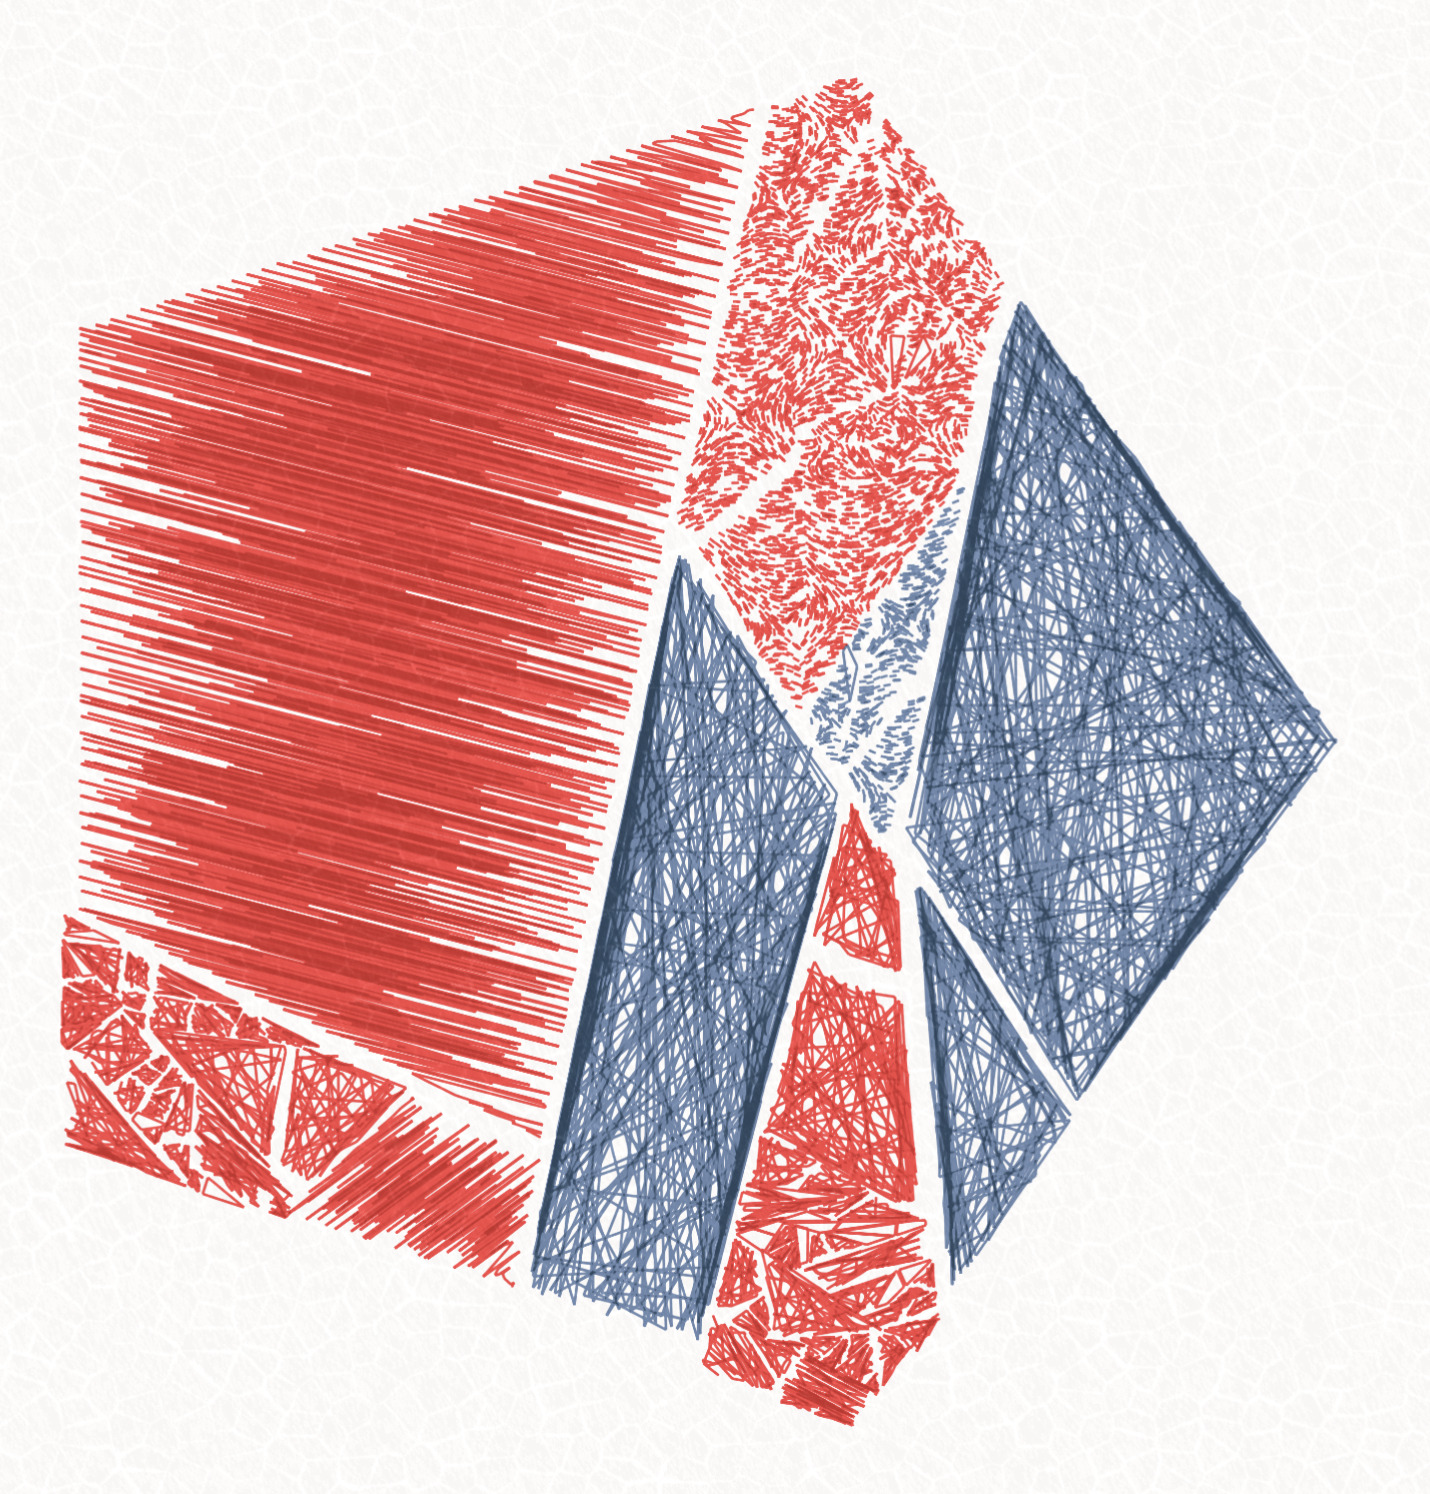
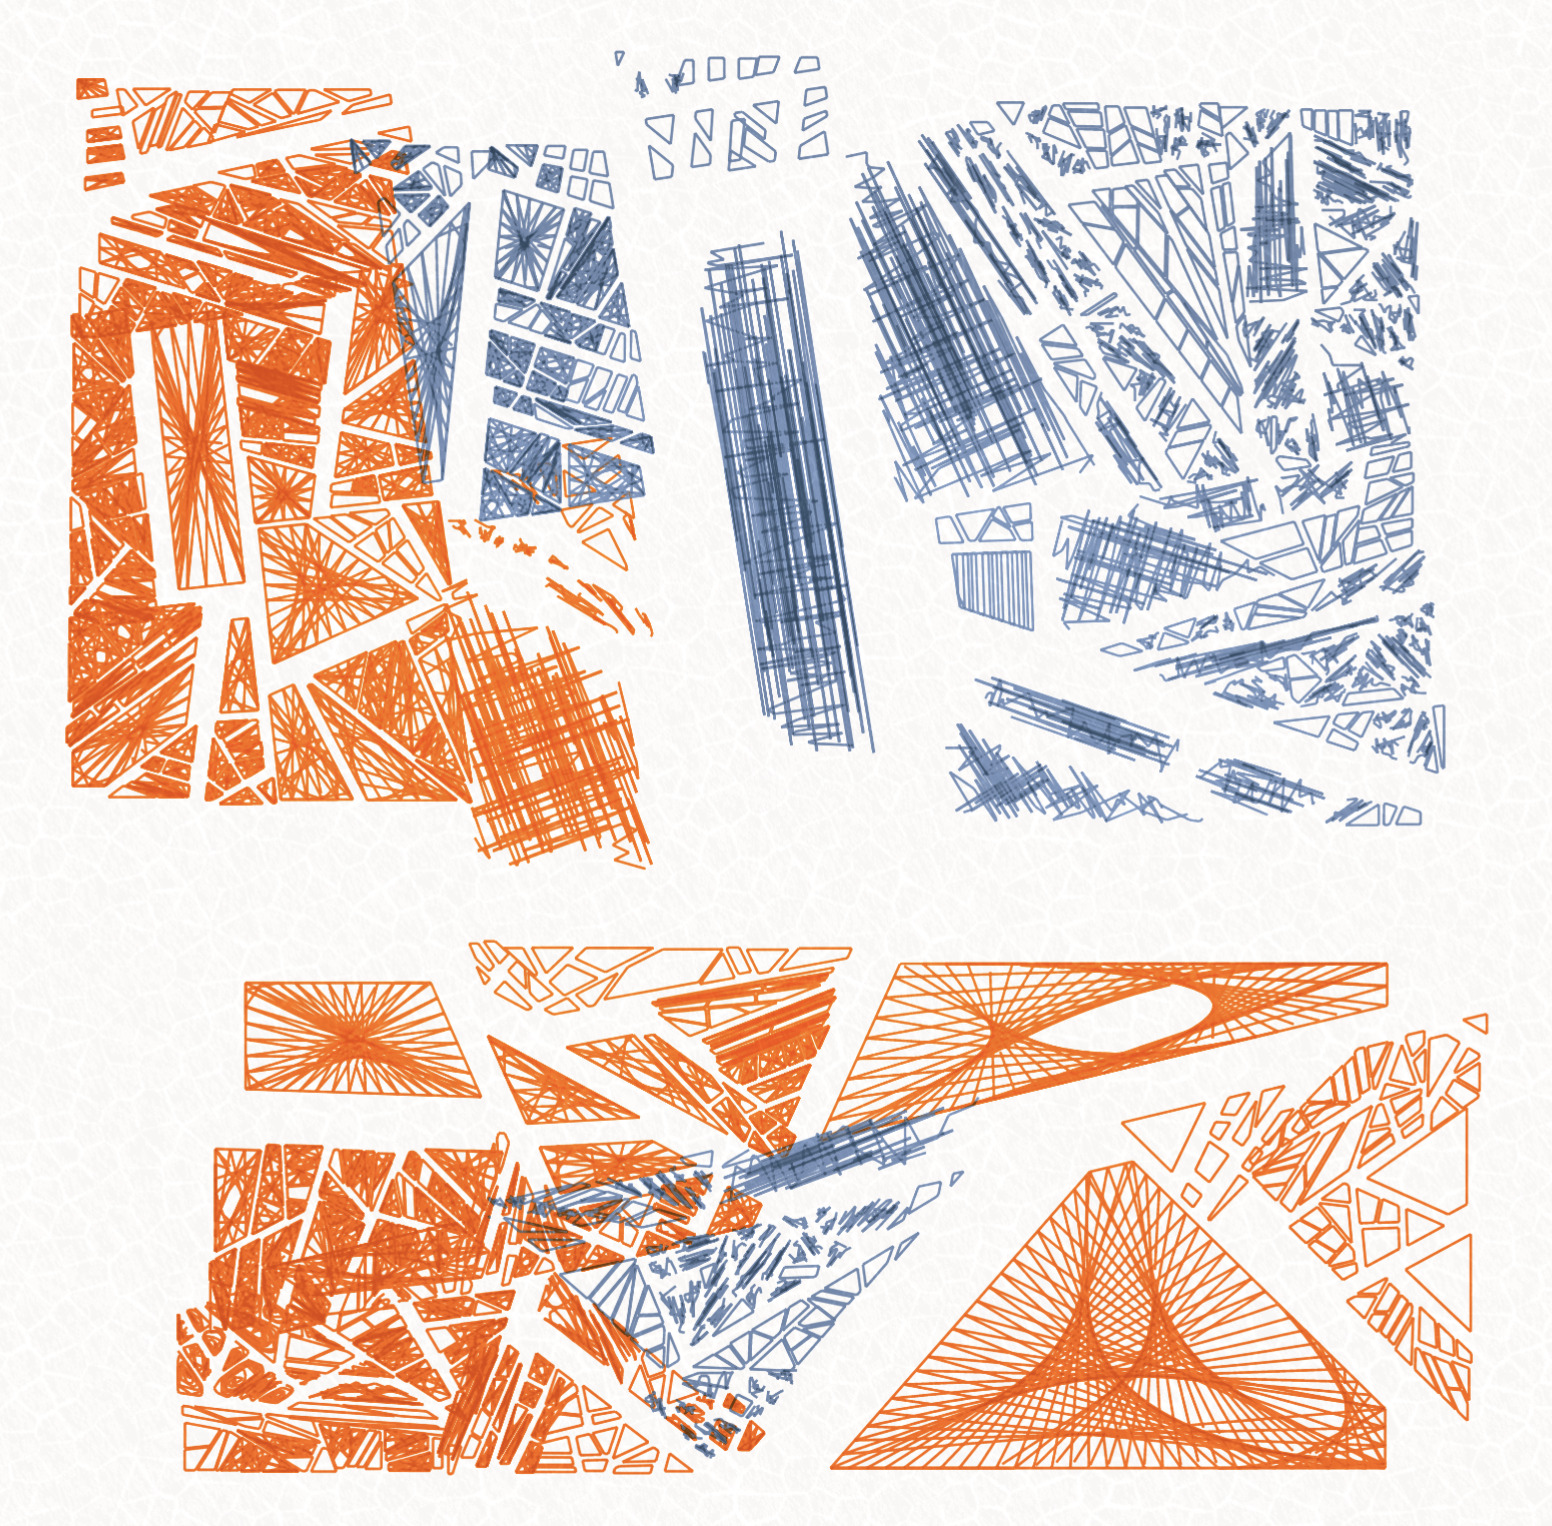
'Distribution' feature expresses the area balance between parts. Here are some examples:
"One Major" (2 examples side by side)
"Two Main" (2 examples side by side)
"Small Parts" (2 examples side by side)
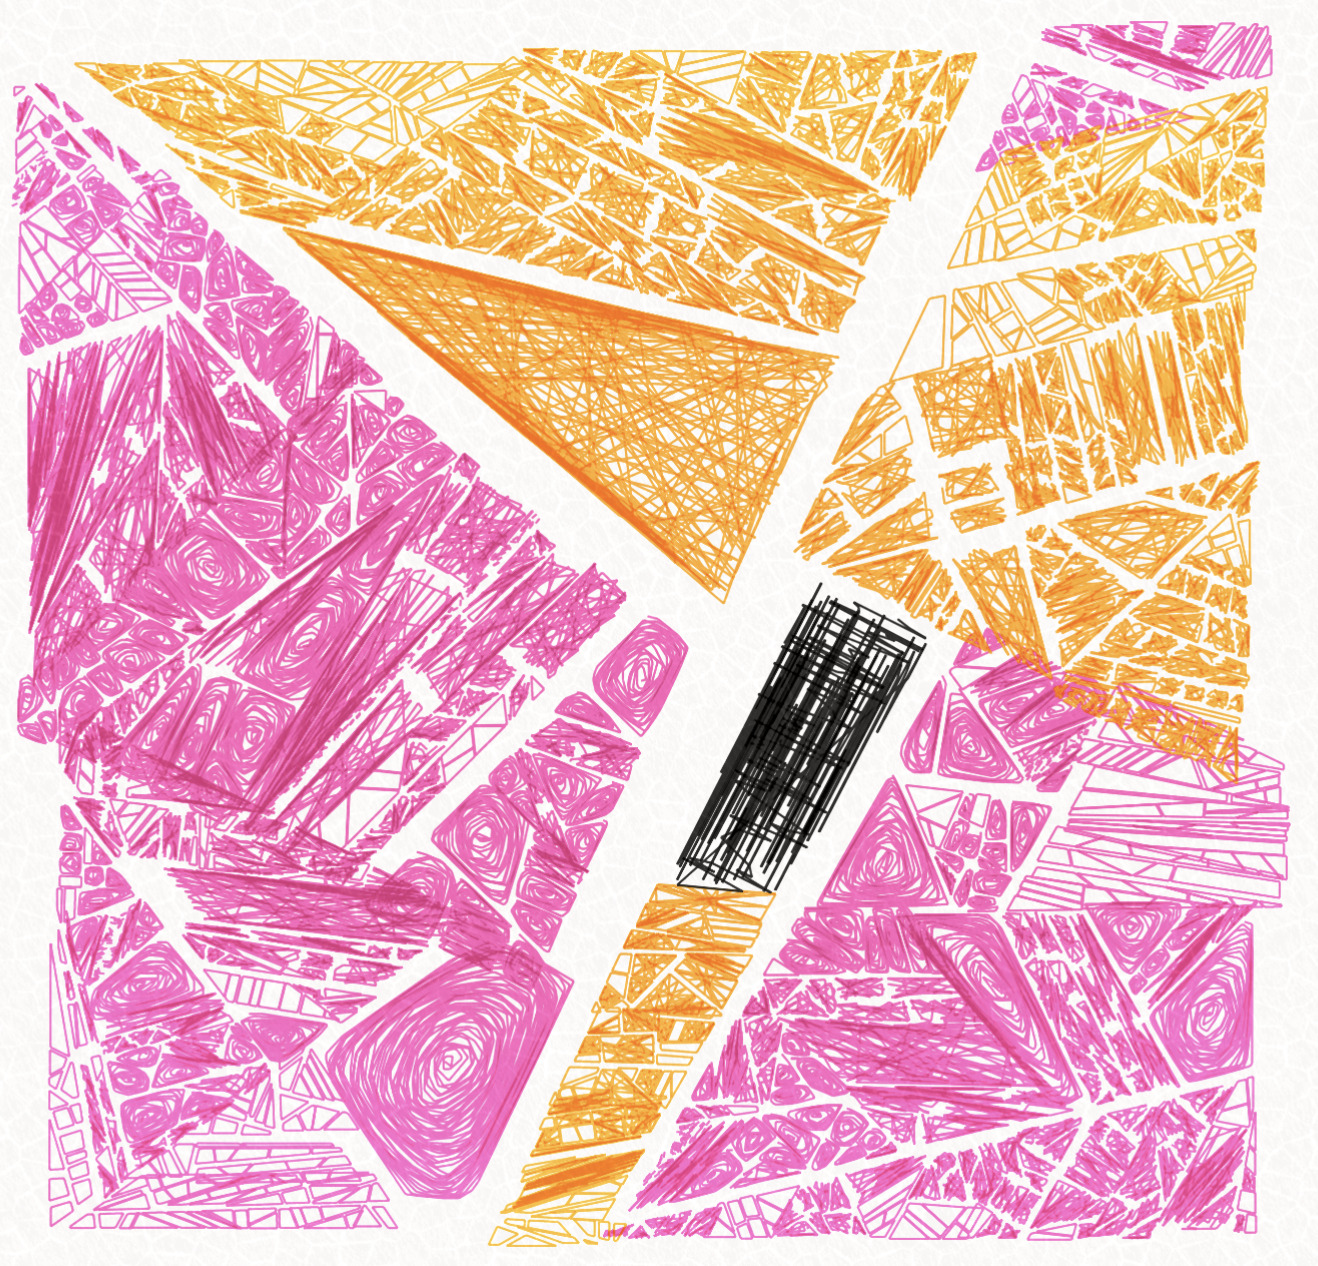
Step 2: the filling
each polygon resulting from the shattering is individually filled with various techniques. That said, the shattering algorithm has already decided how each polygon is colored and filled. There is a higher chance that related parts have same fill and color, but it can still happen that one has many different filling techniques on the same piece:
These are statistically the TOP 10 filling technique combination to most likely occur:
Statistics of feature 'Fill':
                   Web, Spiral: 6.0%
                           Web: 5.7%
                Web, Ping Pong: 3.3%
                   Spiral, Web: 3.3%
                     Ping Pong: 3.1%
                     Scratches: 2.8%
                         Hatch: 2.5%
          Ping Pong, Scratches: 2.3%
                     Stippling: 2.3%
            Web, Spiral, Empty: 2.2%
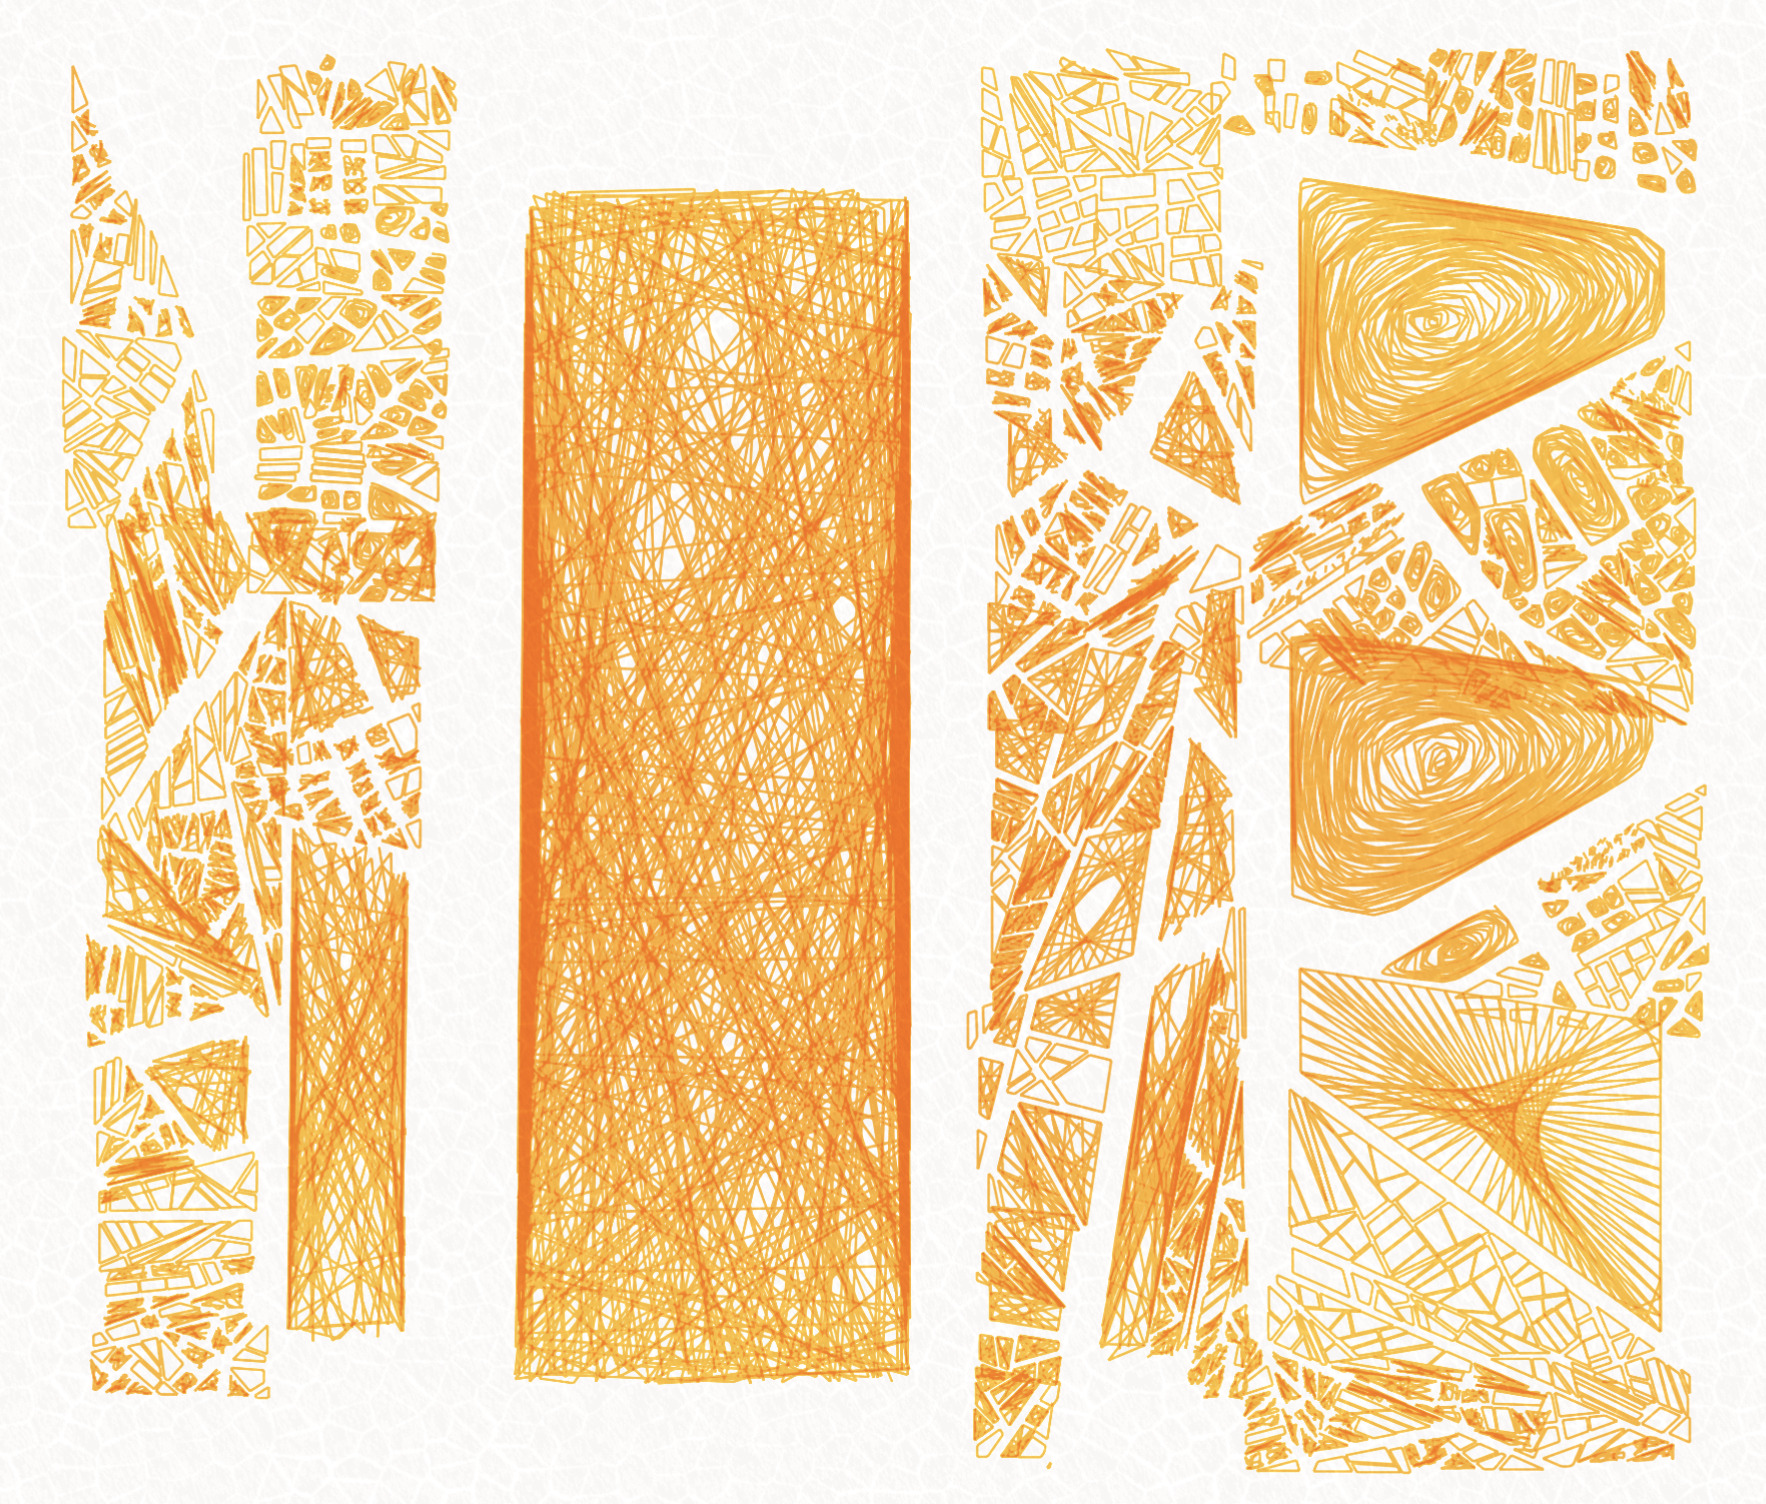
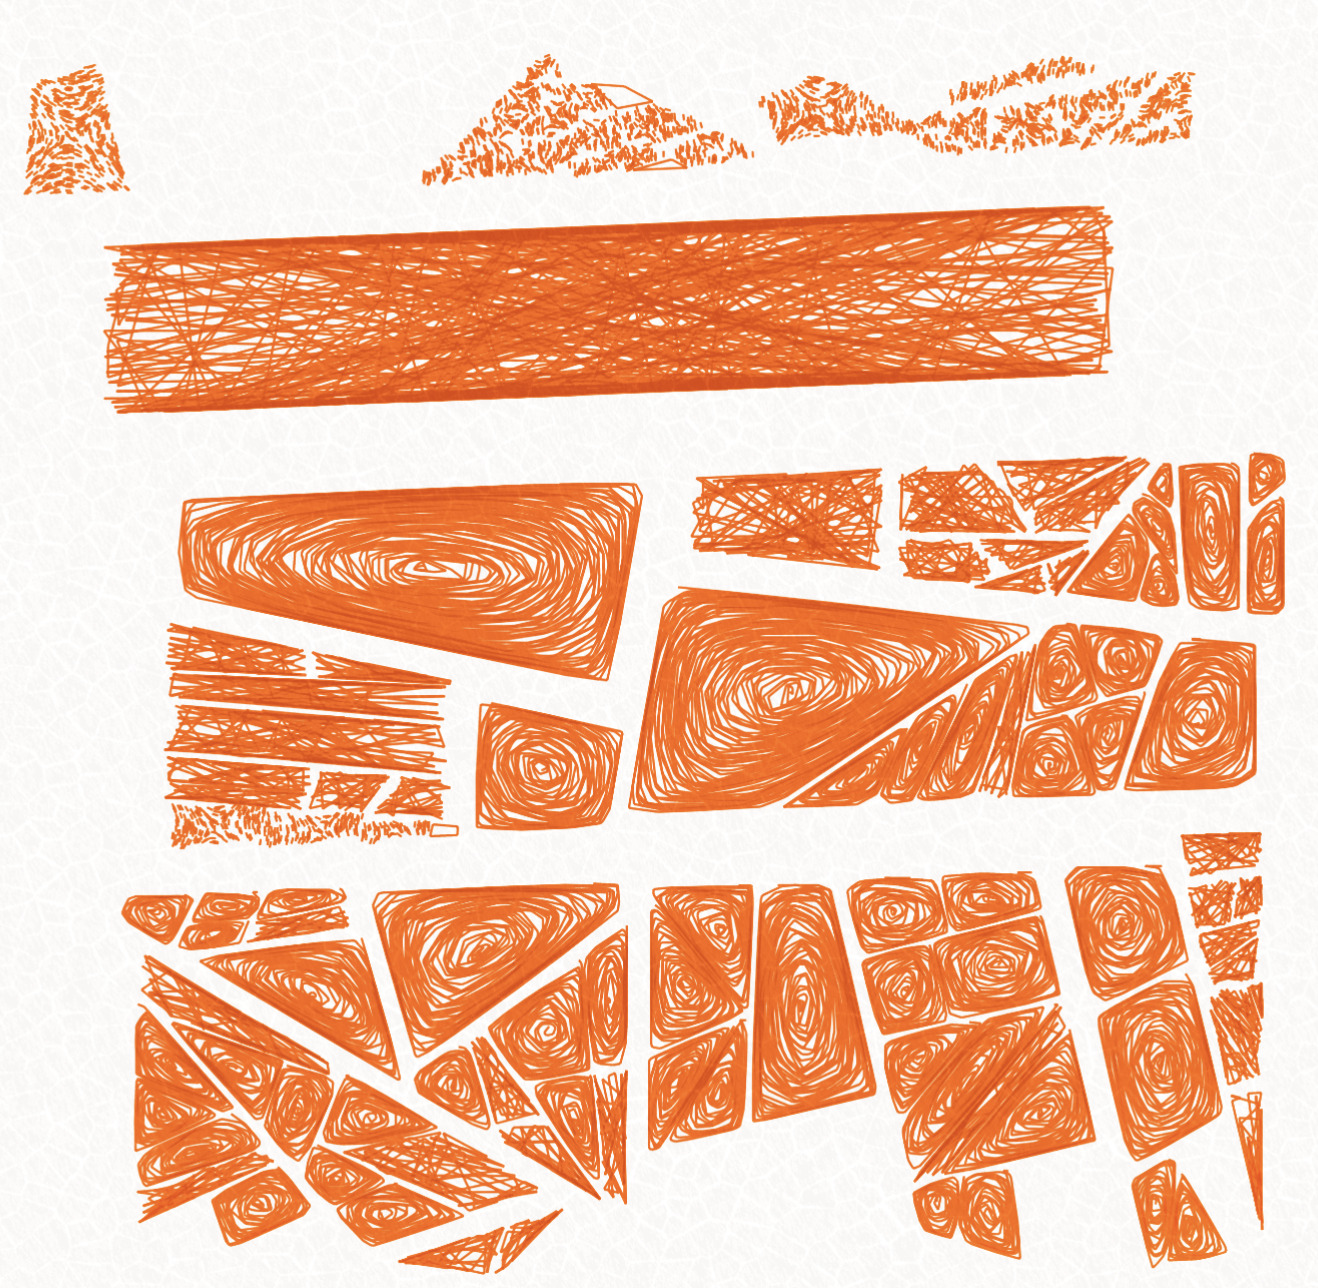
The 66% remaining is going to many different combinations of one of the 8 different filling technique that can occur: Empty, Spiral, Web, Ping Pong, Scratches, Hatch, Stippling, Zigzag which I'm going to detail now:
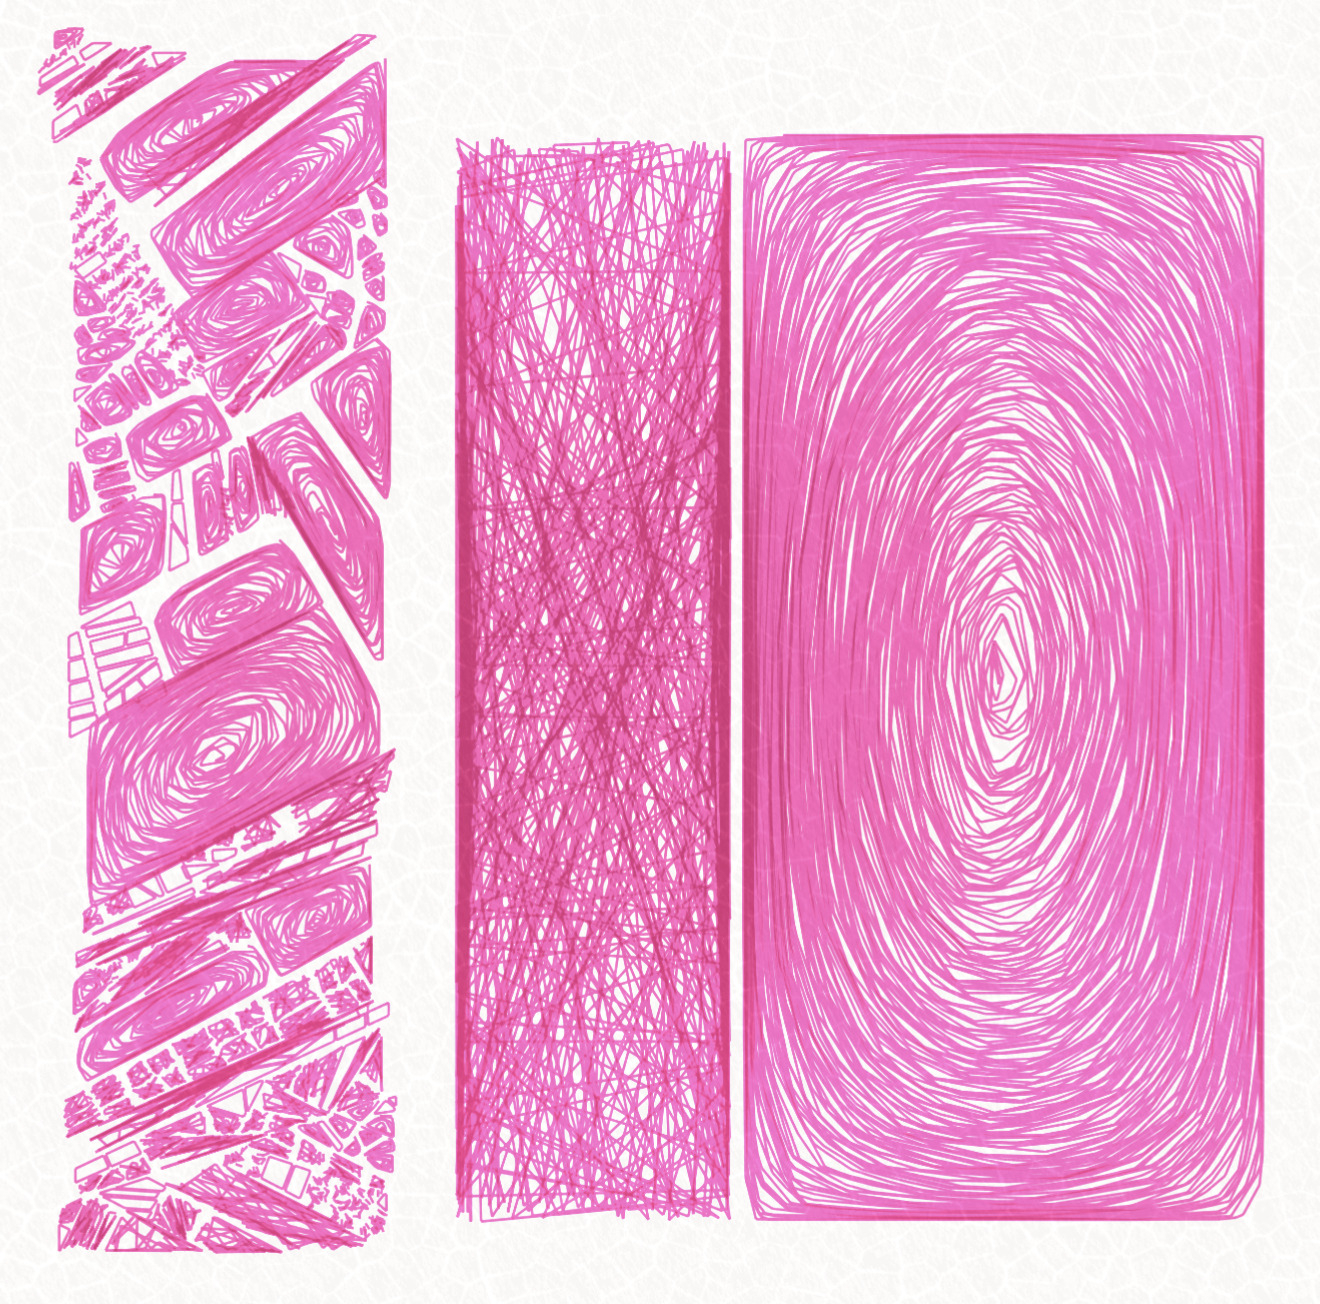
Fill = Empty
There is a first, rare filling technique that consists of NOT filling! but simply stroking the polygon. It is mostly used on small polygons and used in combination with another filling technique.
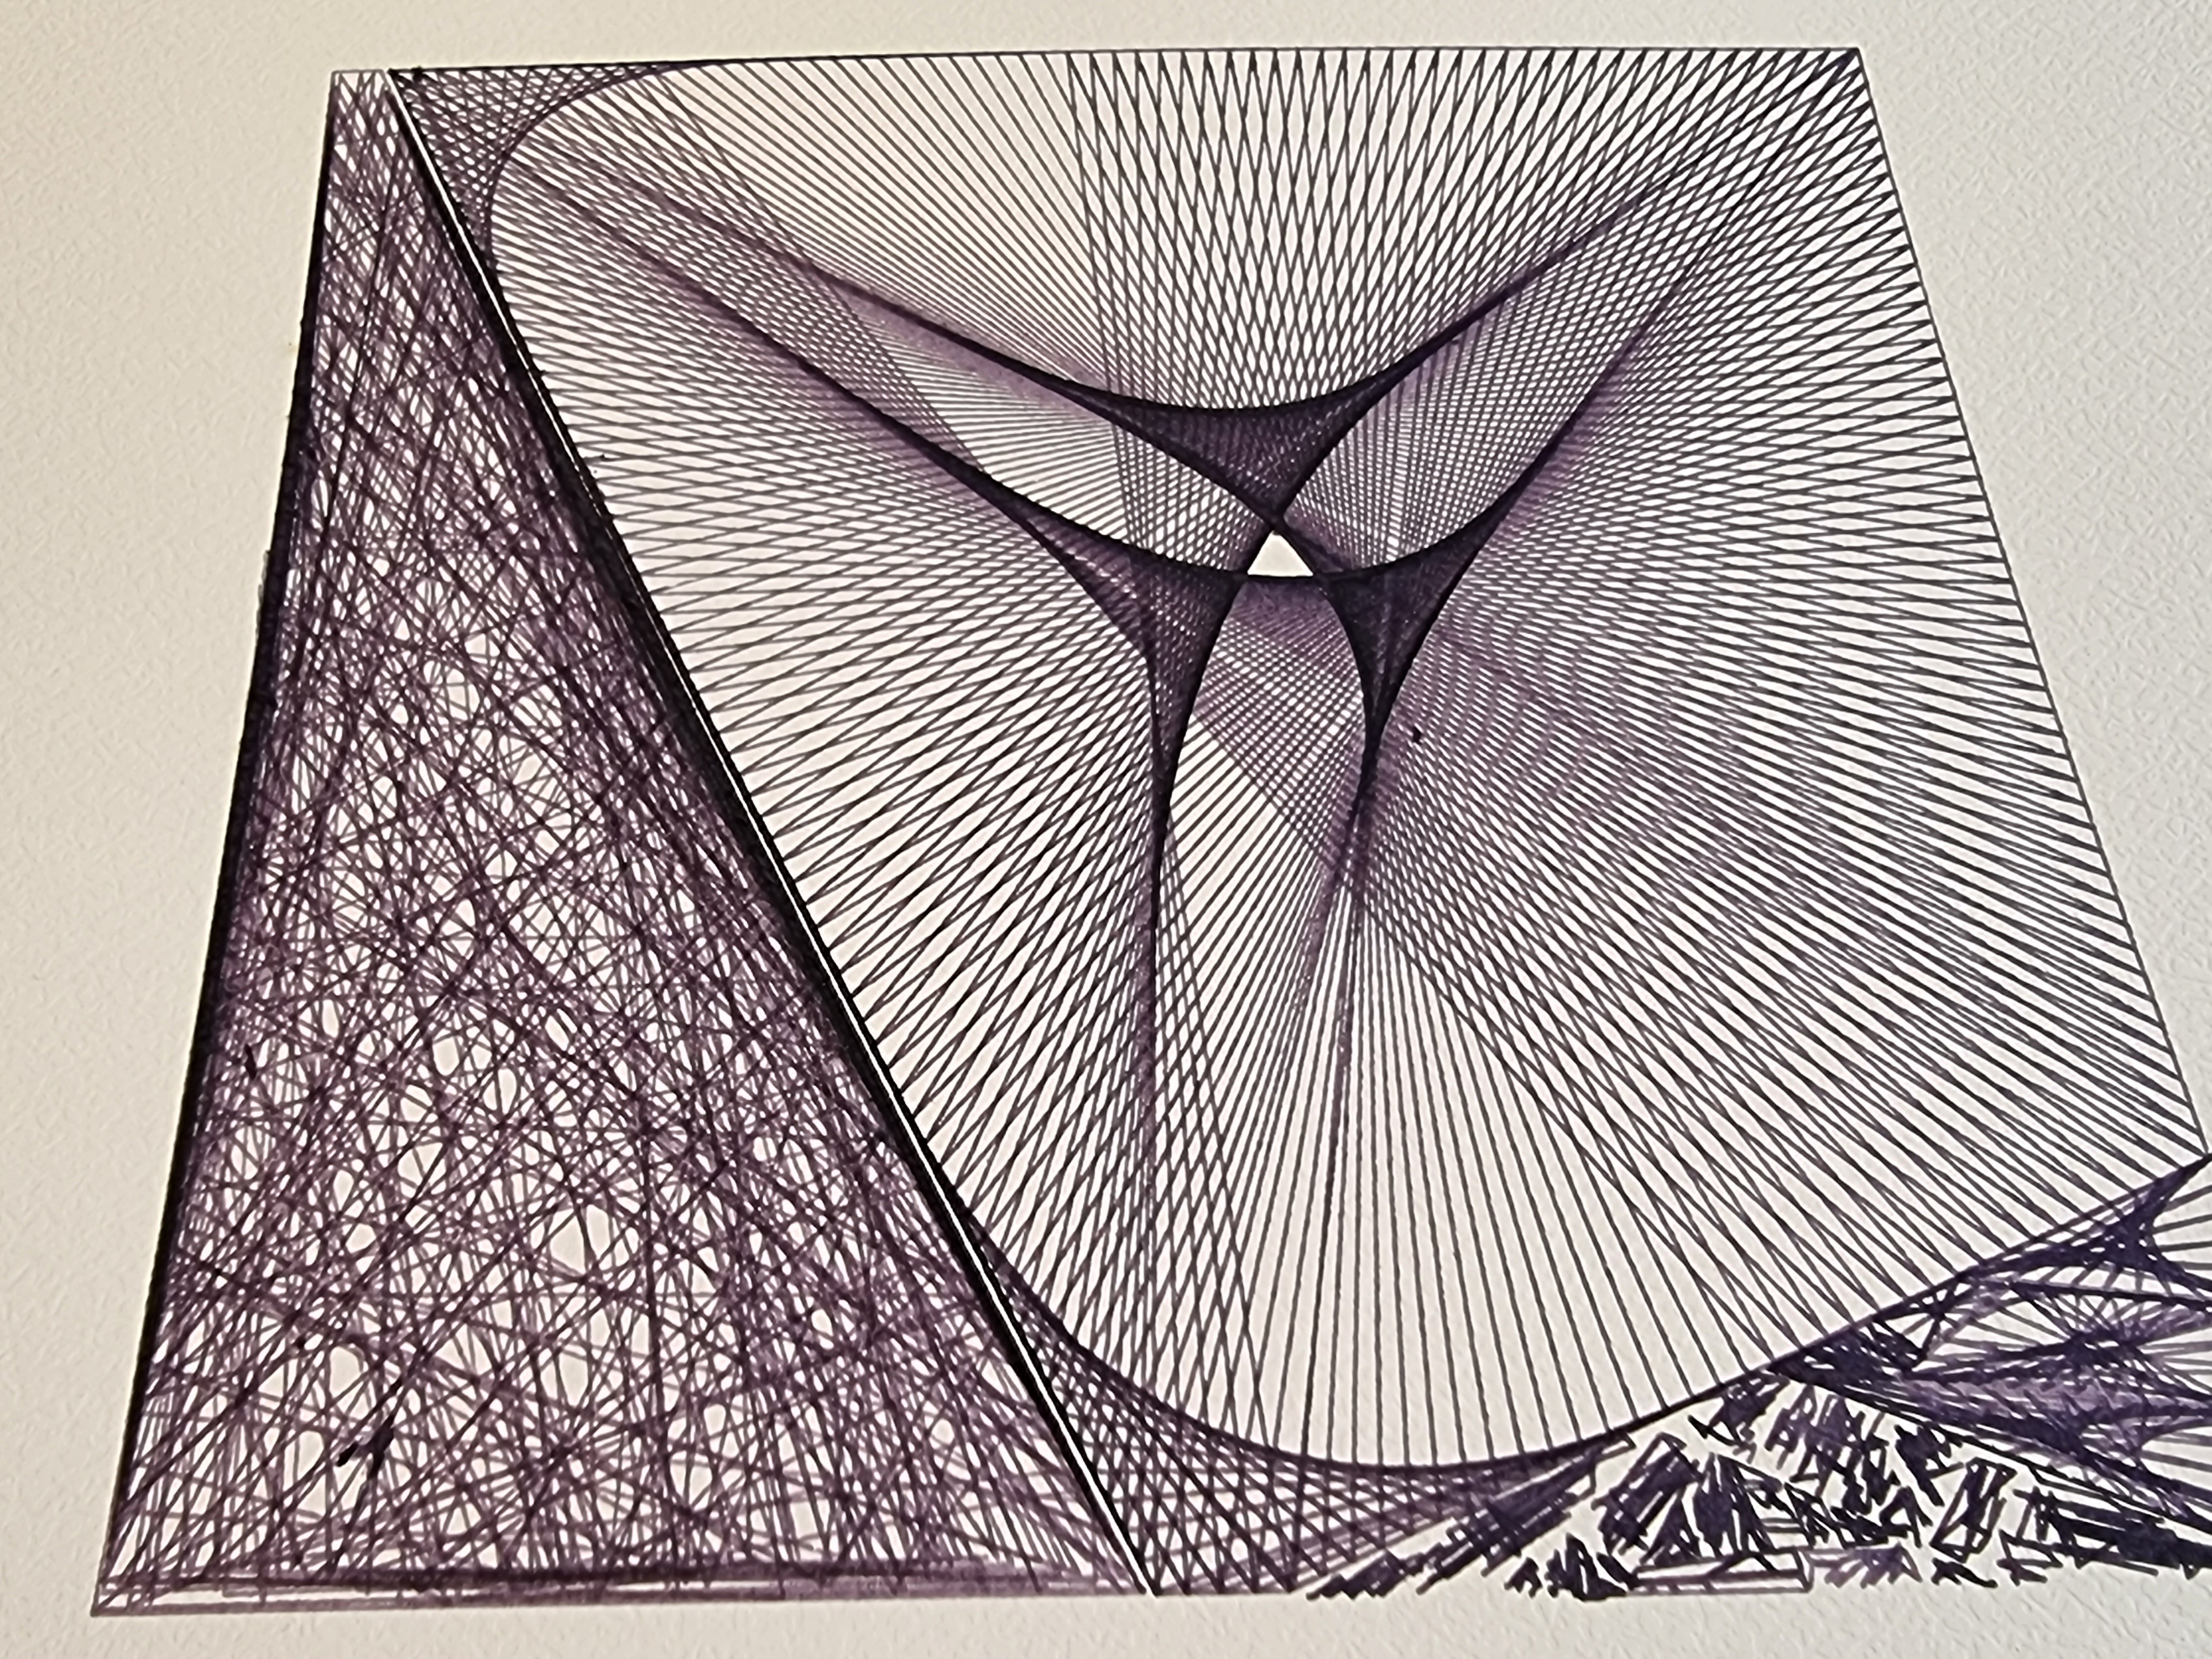
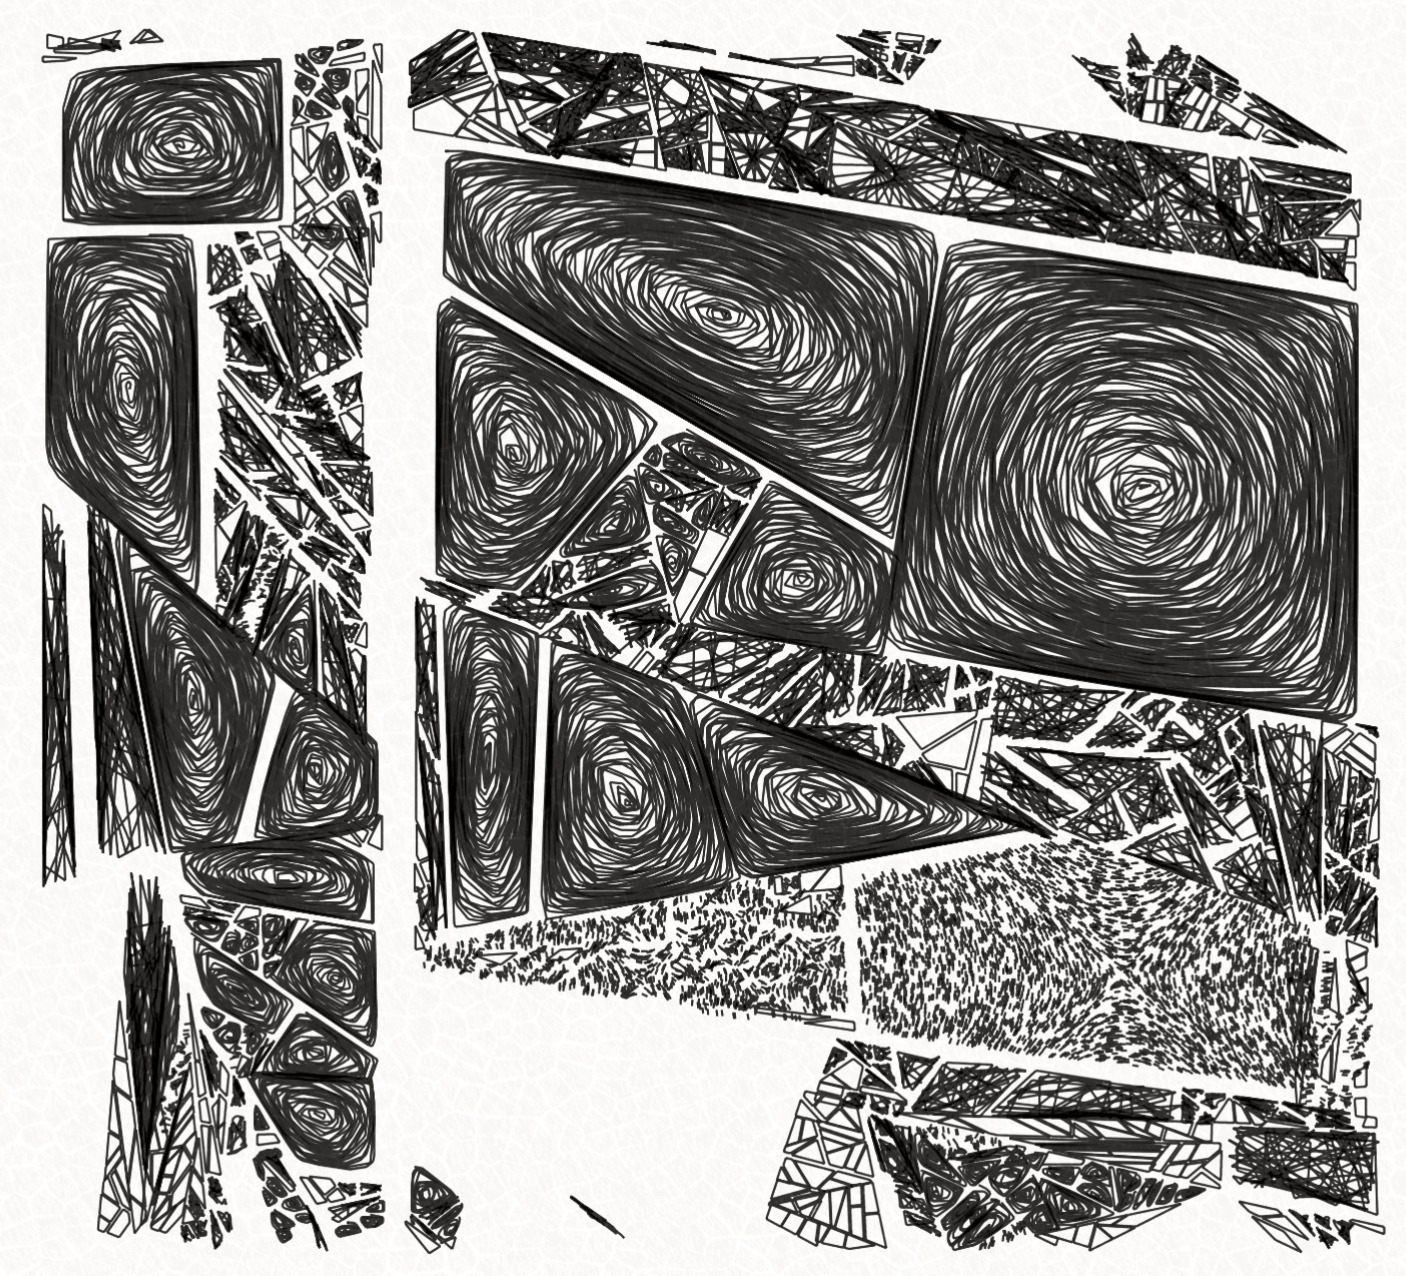
Fill = Spiral
Spiral is the most complex algorithm of the generator and can take up to a few seconds to run in JavaScript. It works by connecting randomly sampled dots by rotating the lines, each iteration scans for a point making the smallest angle turn, this creates a spiral that statistically converge to the center.
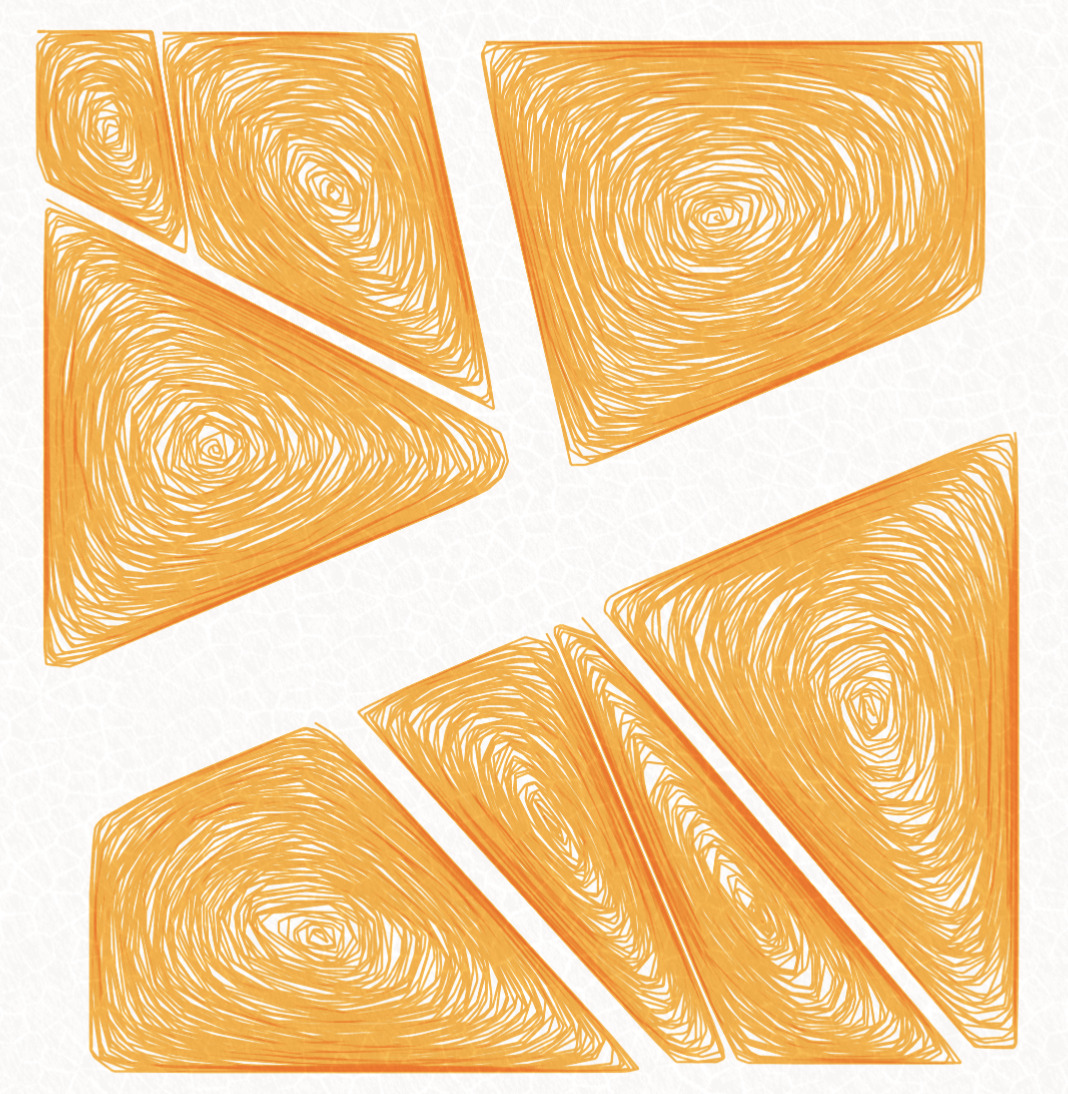
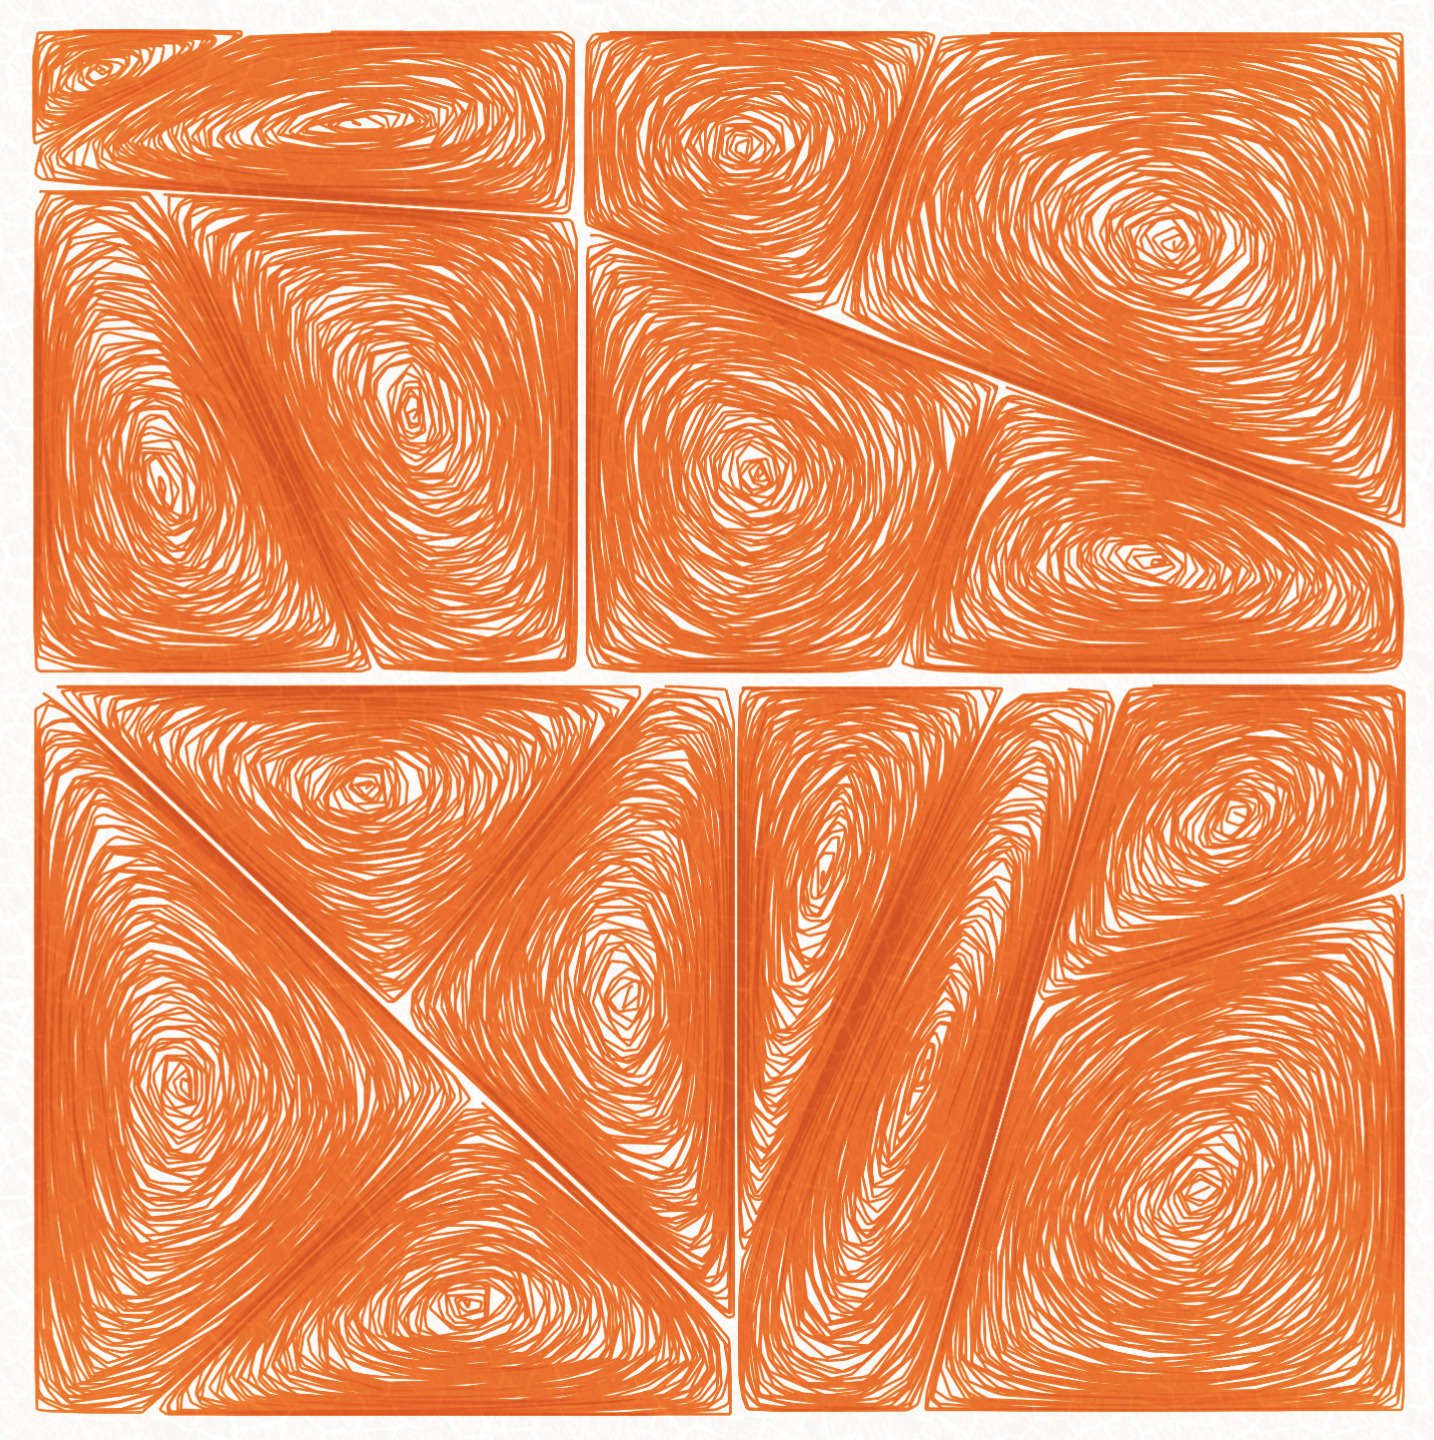
Due to the complexity of the algorithm, I have chosen to bail out some cases to fallback to "Web" filling technique which is why you most likely never get a "Spiral only" filling (it can still happen ~0.4%).
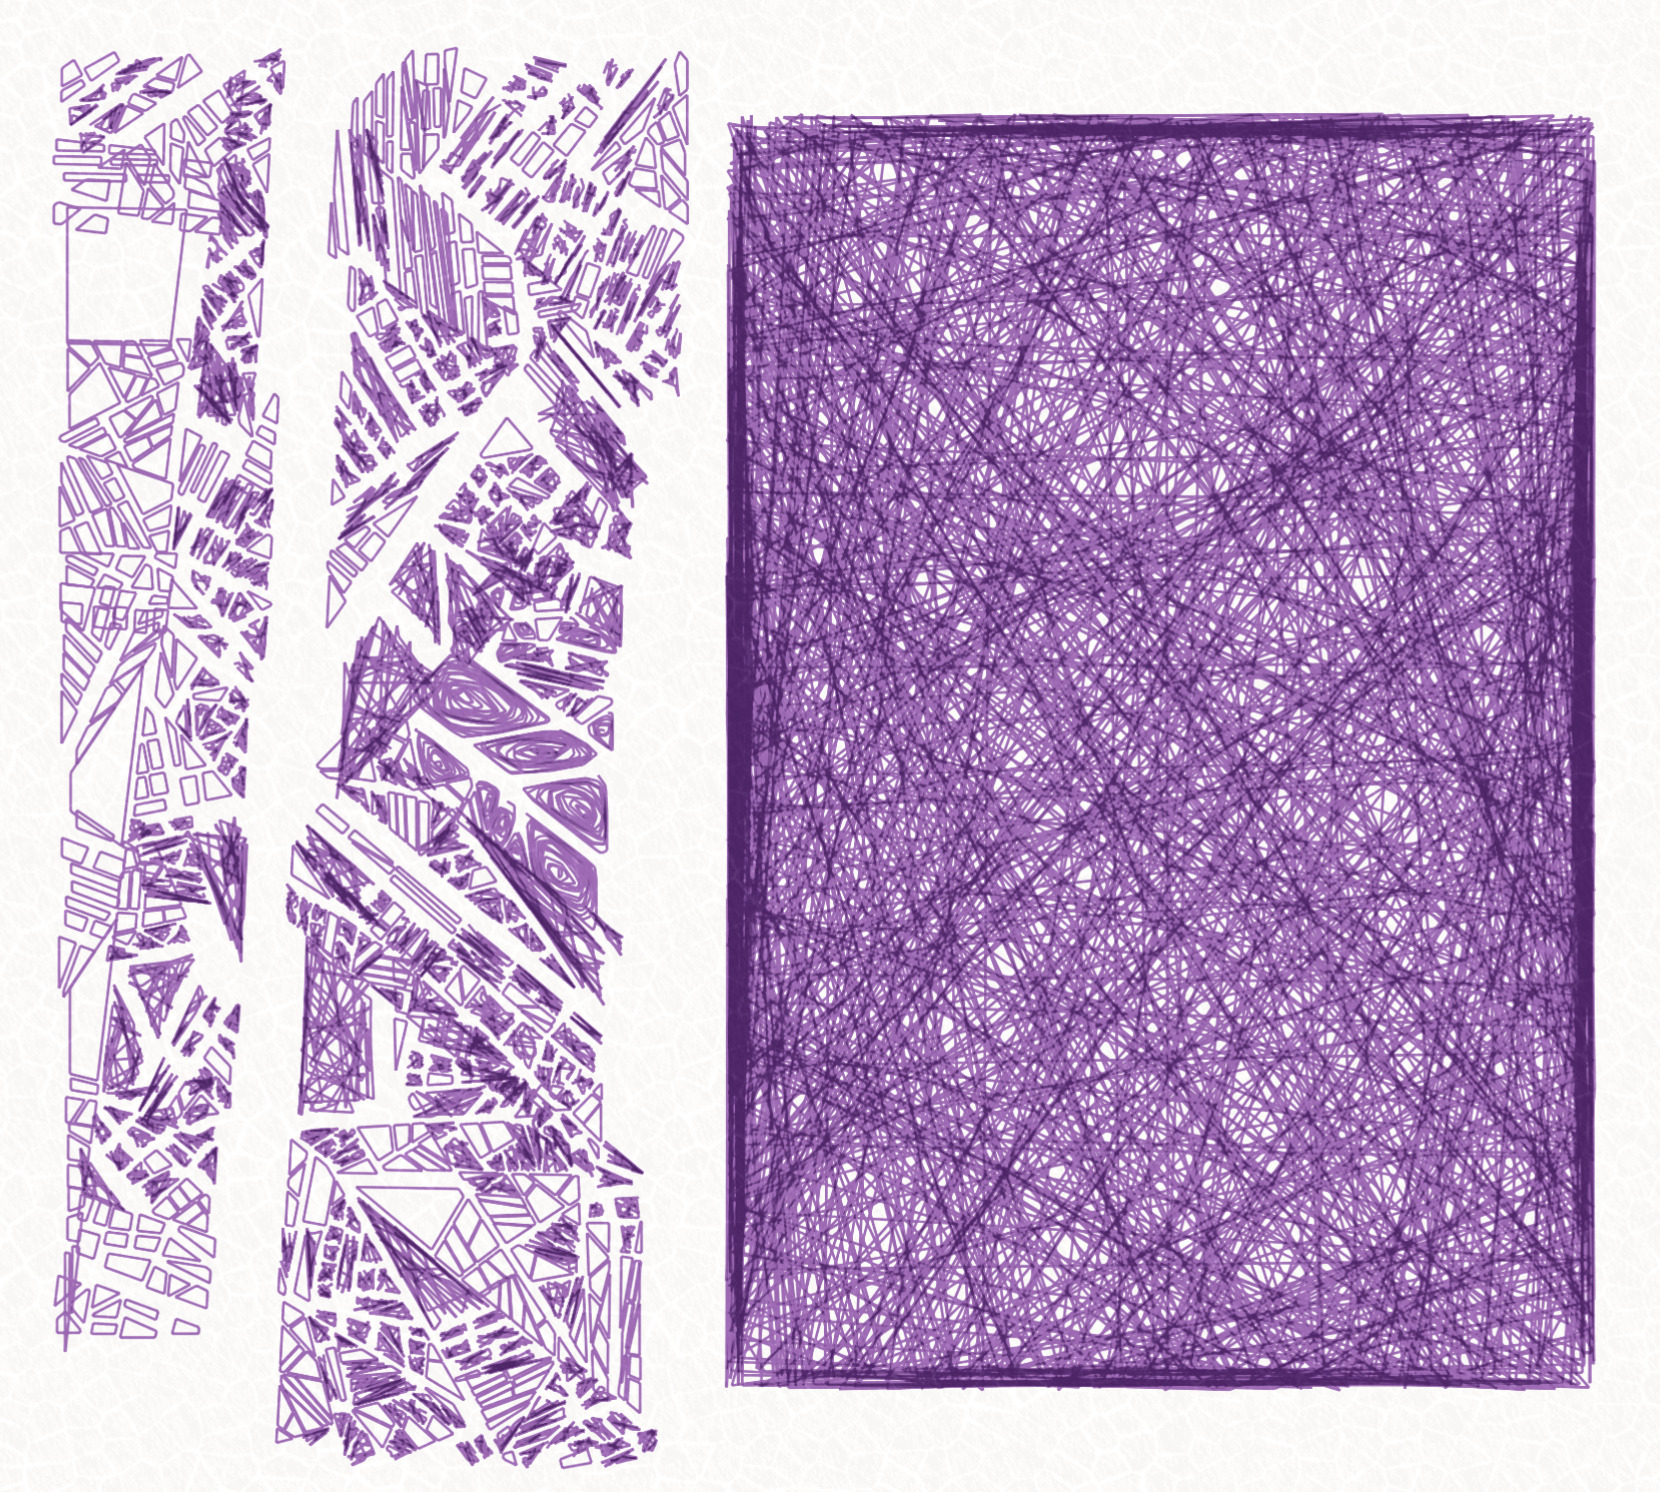
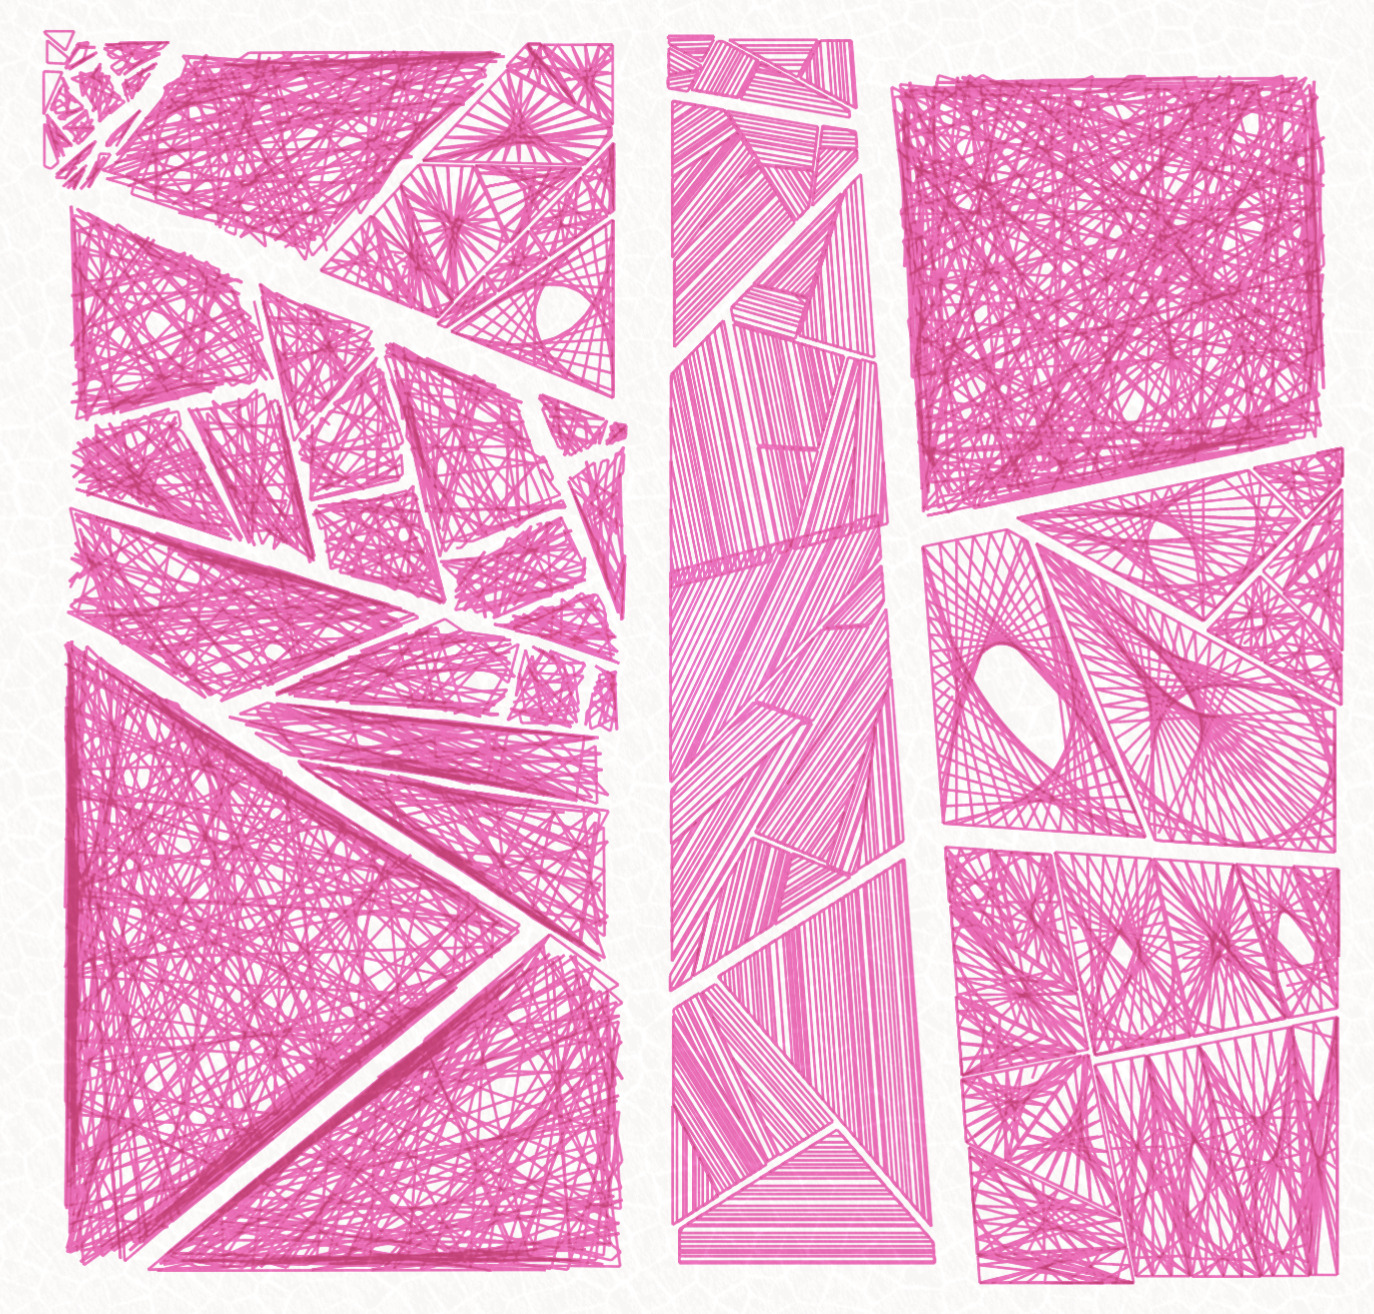
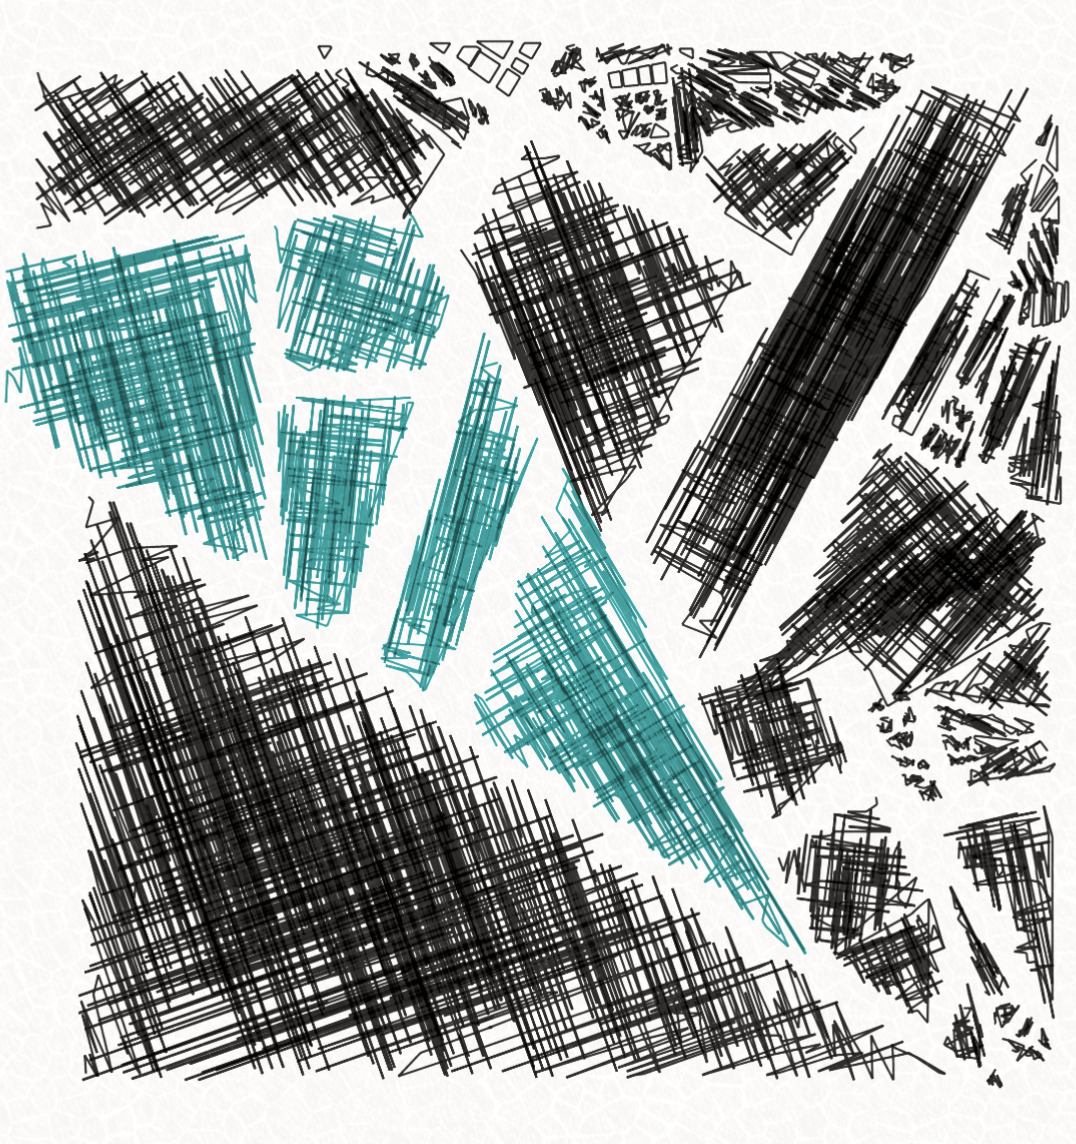
Fill = Web
The web is, after spiral, the second most popular filling technique to happen but is the most likely technique to happen as "standalone" (without combination with another filling technique)
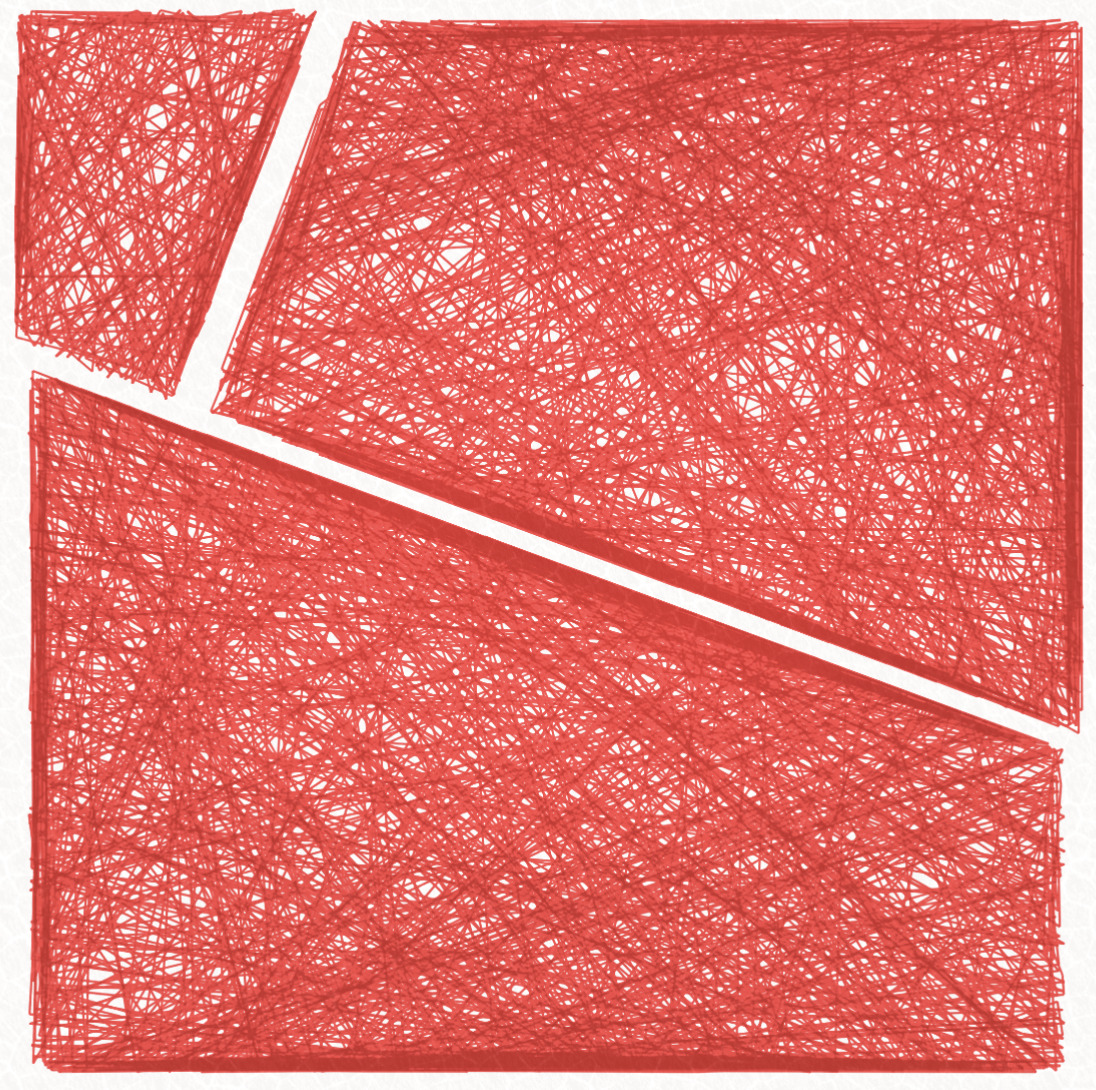
One of the easter eggs of this Fill technique is that it will sometimes also have circles hole that the algorithm will try to avoid:
The algorithm samples a bunch of points along the polygon edge and connects dots randomly. The dots are connected with lines that maximize avoiding the circles and "traversing" the polygon rather than connecting lines that would be along an edge. Points are also samples randomly away from the polygon edge in order to avoid too much paper density problem – it creates an interesting border width effect.
Fill = Ping Pong
Ping Pong filling is the idea to throw a ray that bounces on the polygon edge.
The basic idea is to sample points along the polygon perimeter and then to do a permutation of indexes that can for instance looks like this: 0, 100, 200, 1, 101, 201, 2, 102, 202,...*.
Many optimizations were done on this to make the plot viable. Each line is traced by counting how much lines traversed at a given position and will stop as soon as it's too "crowded".
We can notice the algorithm at work on the previous example as we see some "gaps" near the intersection of some lines, but in practice, a plot will be generally fine as the ink will "bleed" a bit and fill these gaps.
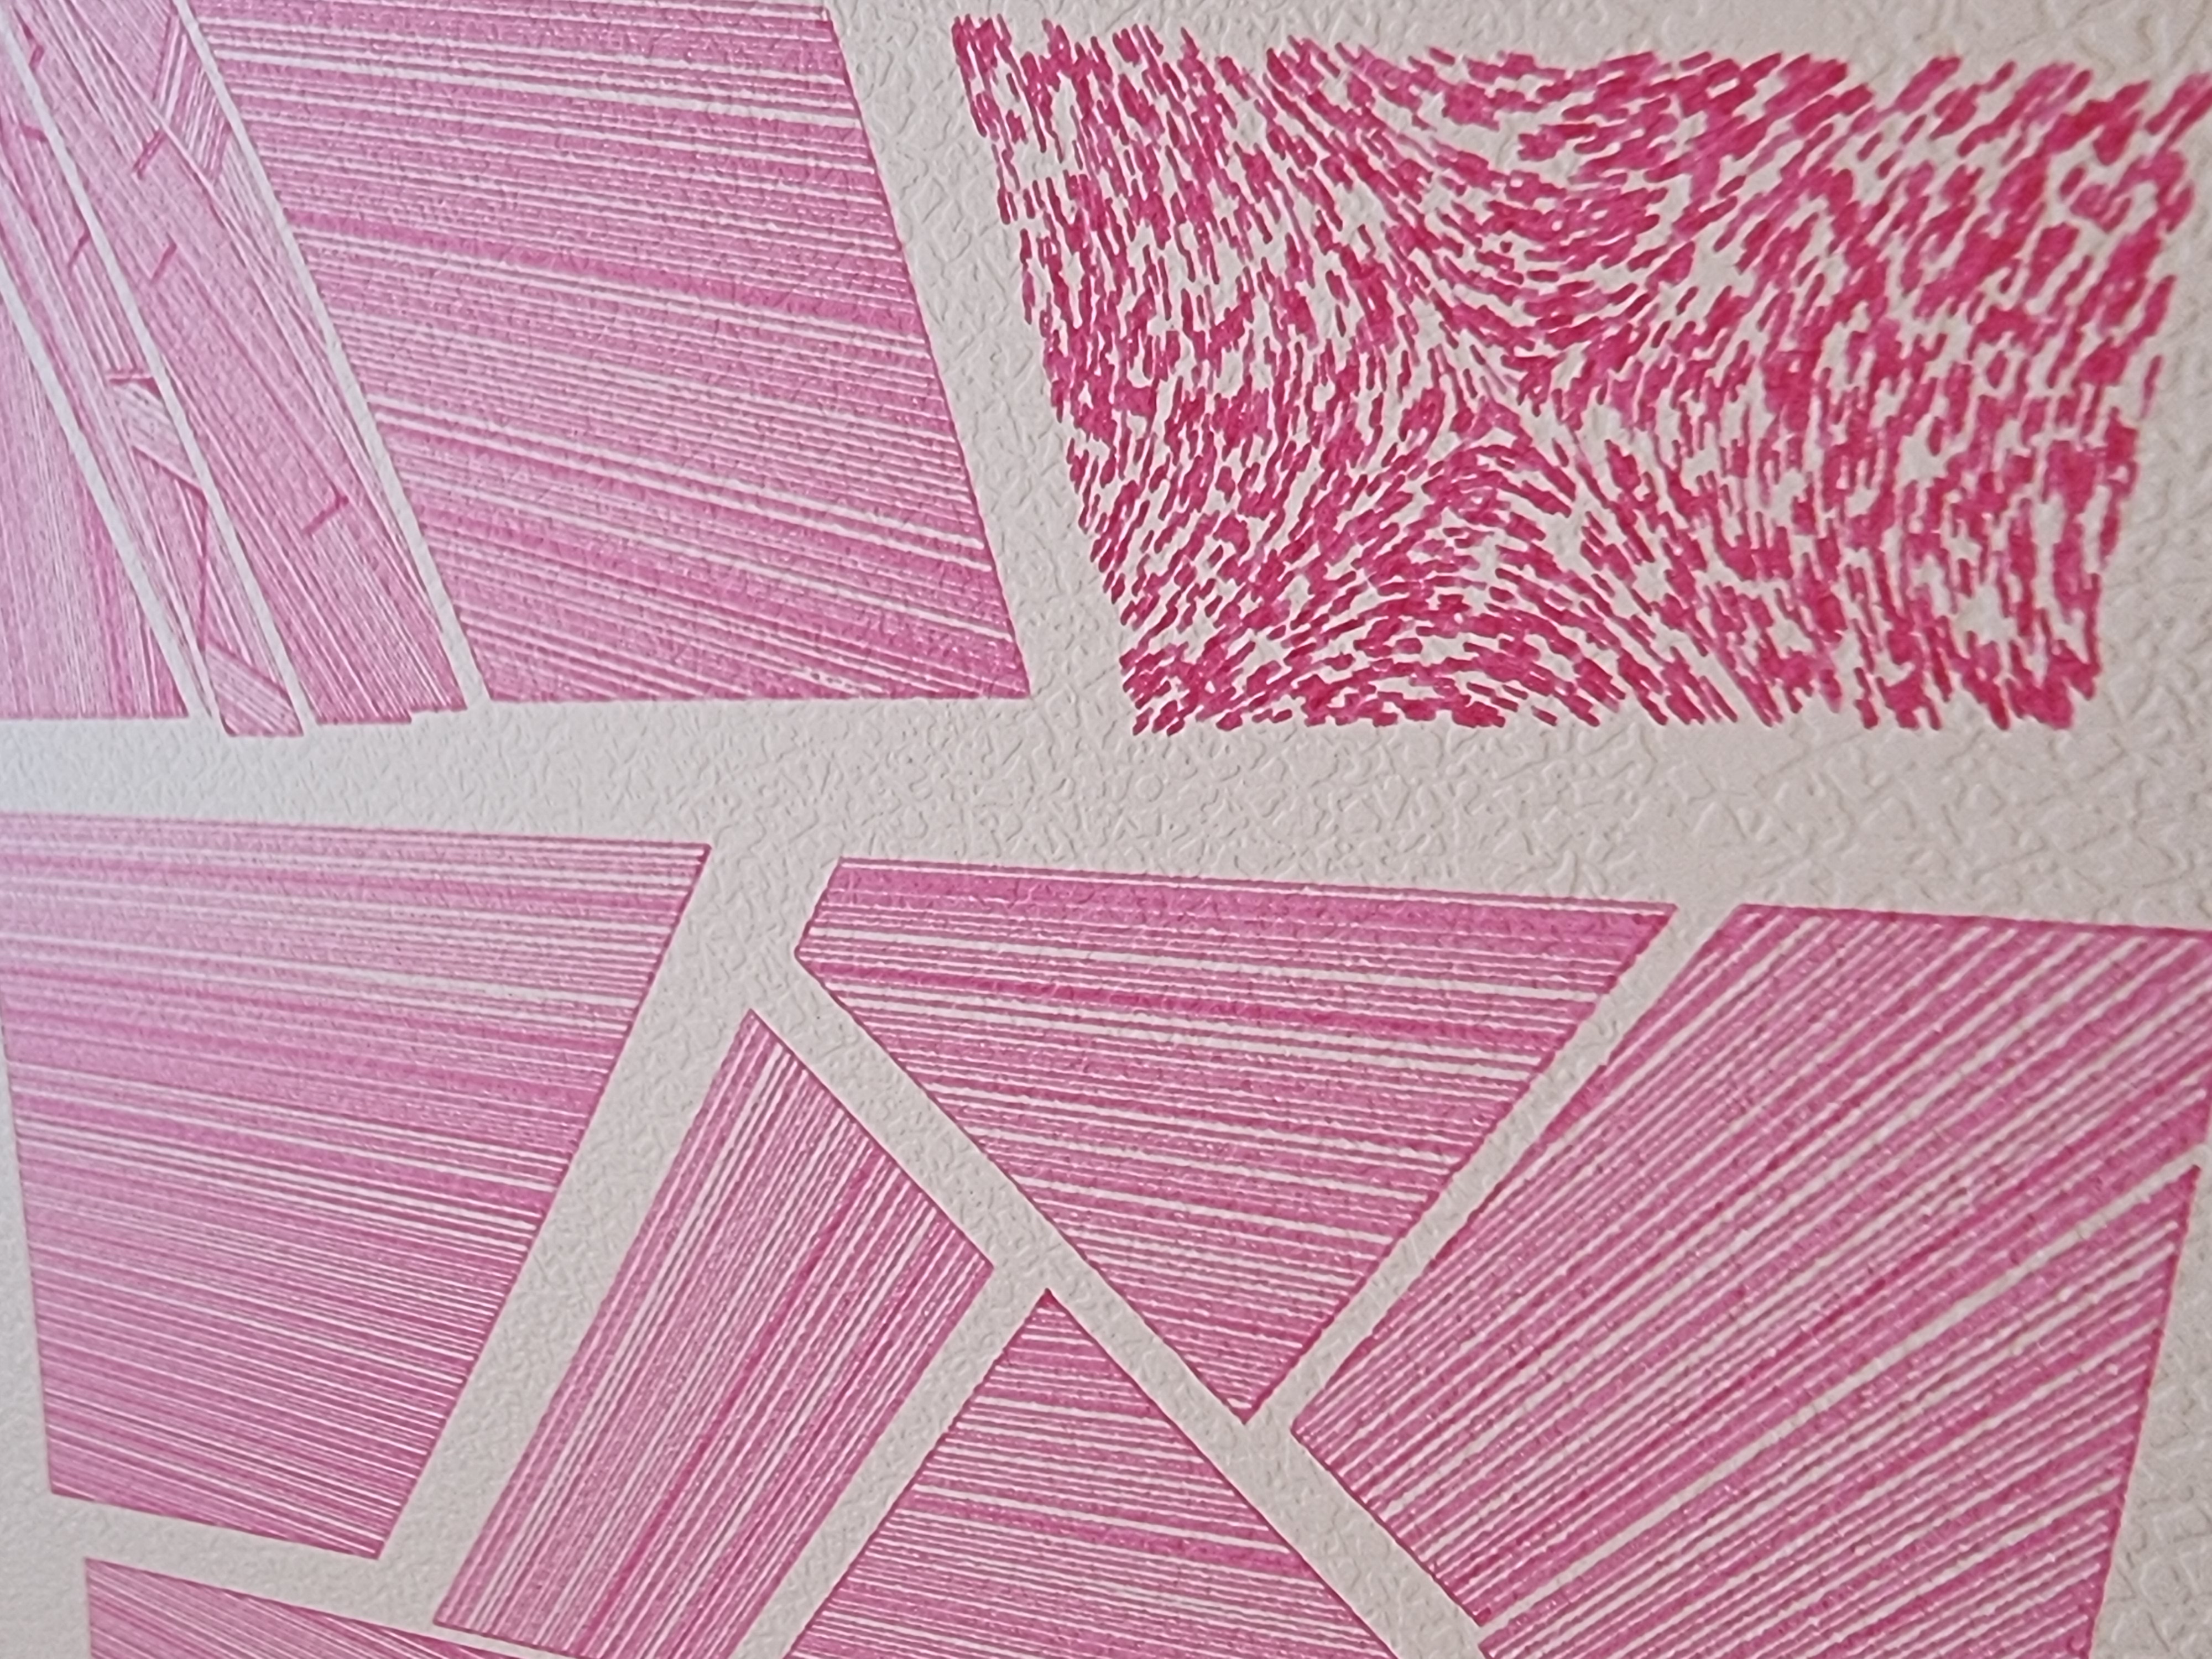
Fill = Hatch
the hatching technique traces parallel lines with a varying distance to produces a fabric pattern. The lines are chosen in a way that they are aligned to the longest segment that can exists inside the polygon.
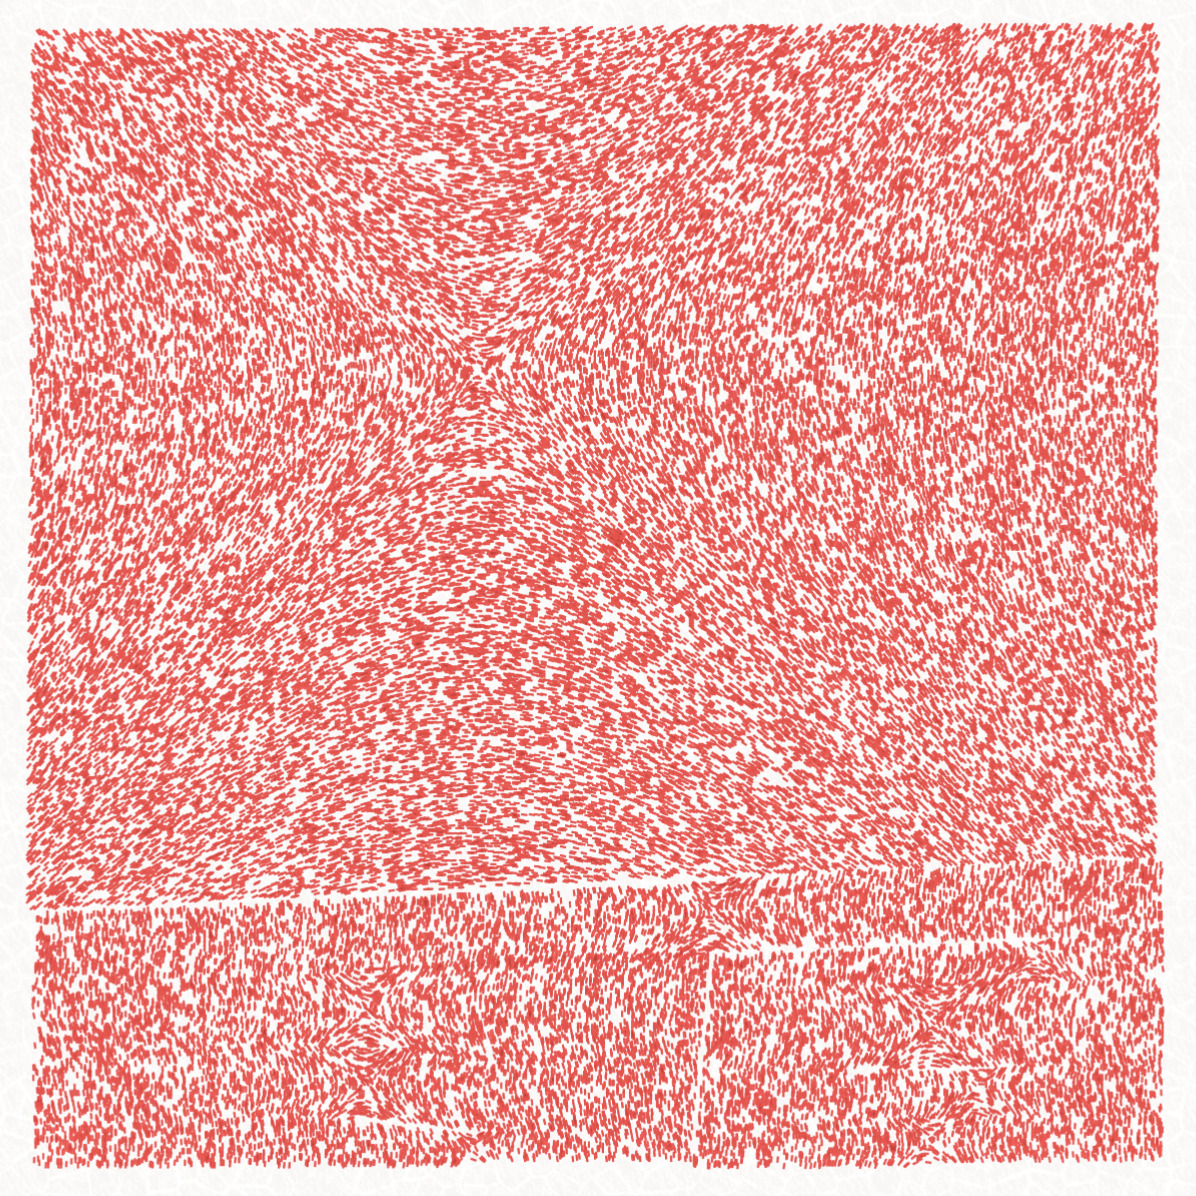
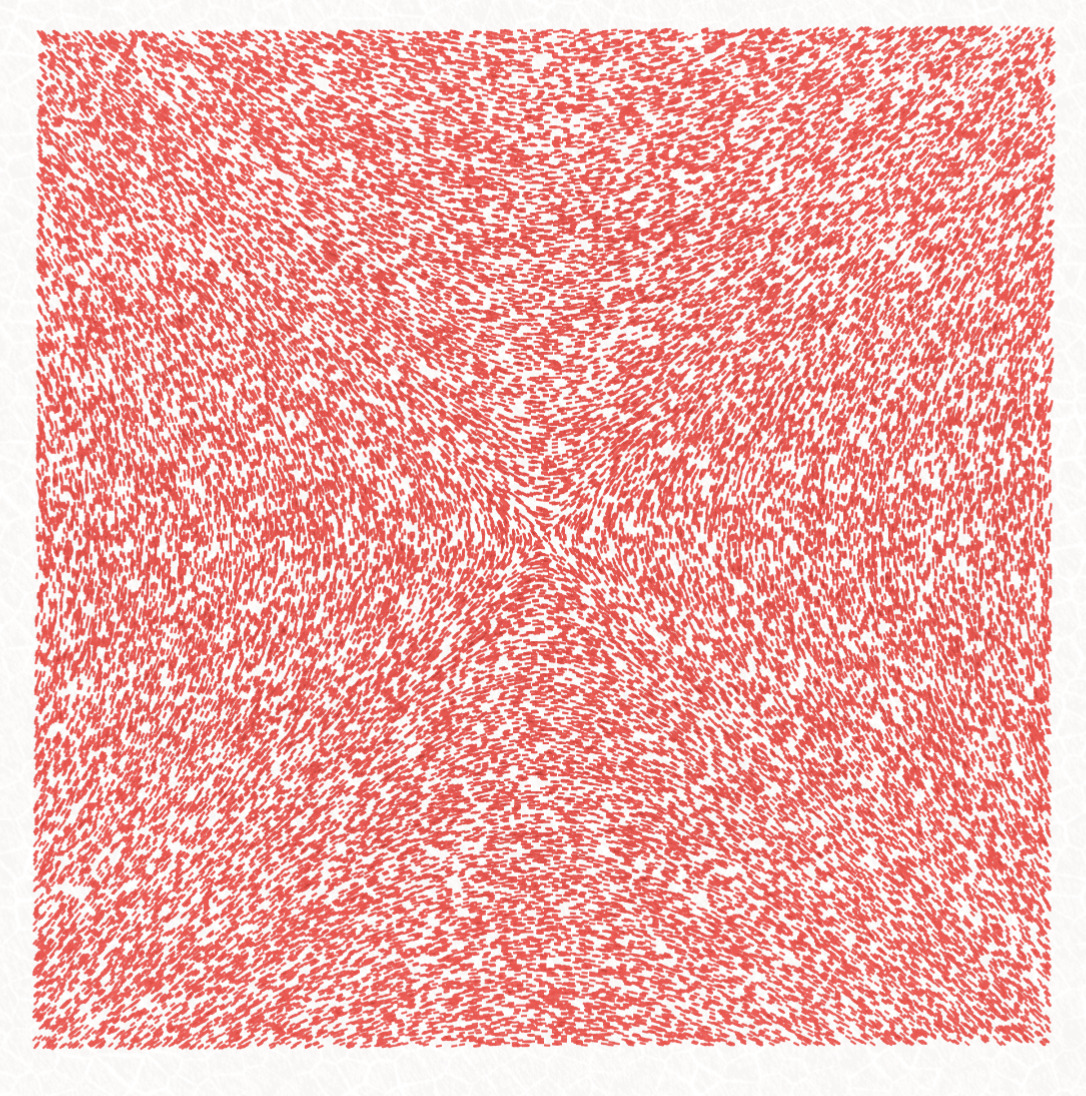
Fill = Stippling
the stippling technique is implemented with many samples points from which a small line stroke is done. The line stroke segment, which is one millimeter long, is oriented following a simple field determined with the center of the polygon: atan2(cx - p[0], cy - p[1])

Fill = Scratches
Scratches are sorting randomly samples points on two perpendicular axis that follow the general polygon direction.
Fill = Zigzag
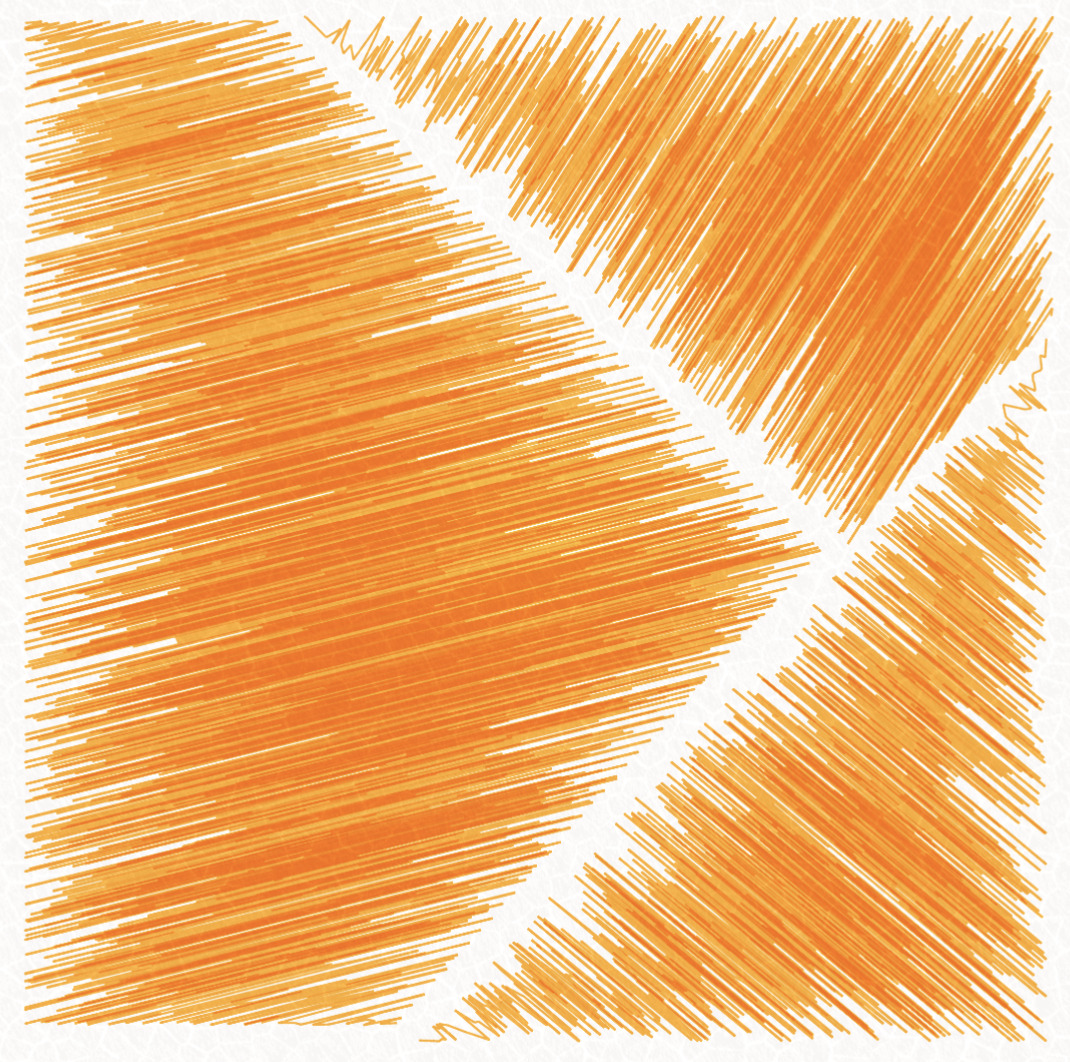
Zigzag has a similar idea as in Scratches except it only traces line on one axis and will only sample points on the edge.
Step 3: post-processed effects
To give more life to the digital shape, I have added some paper grain effects as well as a lighting effect that grows from the center.
It is important to note that I actually generate 2 SVGs:
- one dedicated for the WebGL shaders where I use #0FF, #F0F, #FF0 colors and addition mode to be able to tell what even ink there is at a position. It allows me to implement some sort of ink simulation (those which remains minimal, but using opacity to express the saturation of an ink and each color defines 2 colors on each it derives too – for instance the yellow of Diamine Amber is diverging to orange tones)
- a second SVG is the downloadable SVG that tries to approach as much as possible the ink color and have layers ready for the plotter. Note that you can directly drag&drop (or right-click) from the digital canvas itself (thanks to a hidden
<img>in the DOM)
Palette
The art pieces are picking colors among a palette of 9 curated inks from Diamine that looks like this:
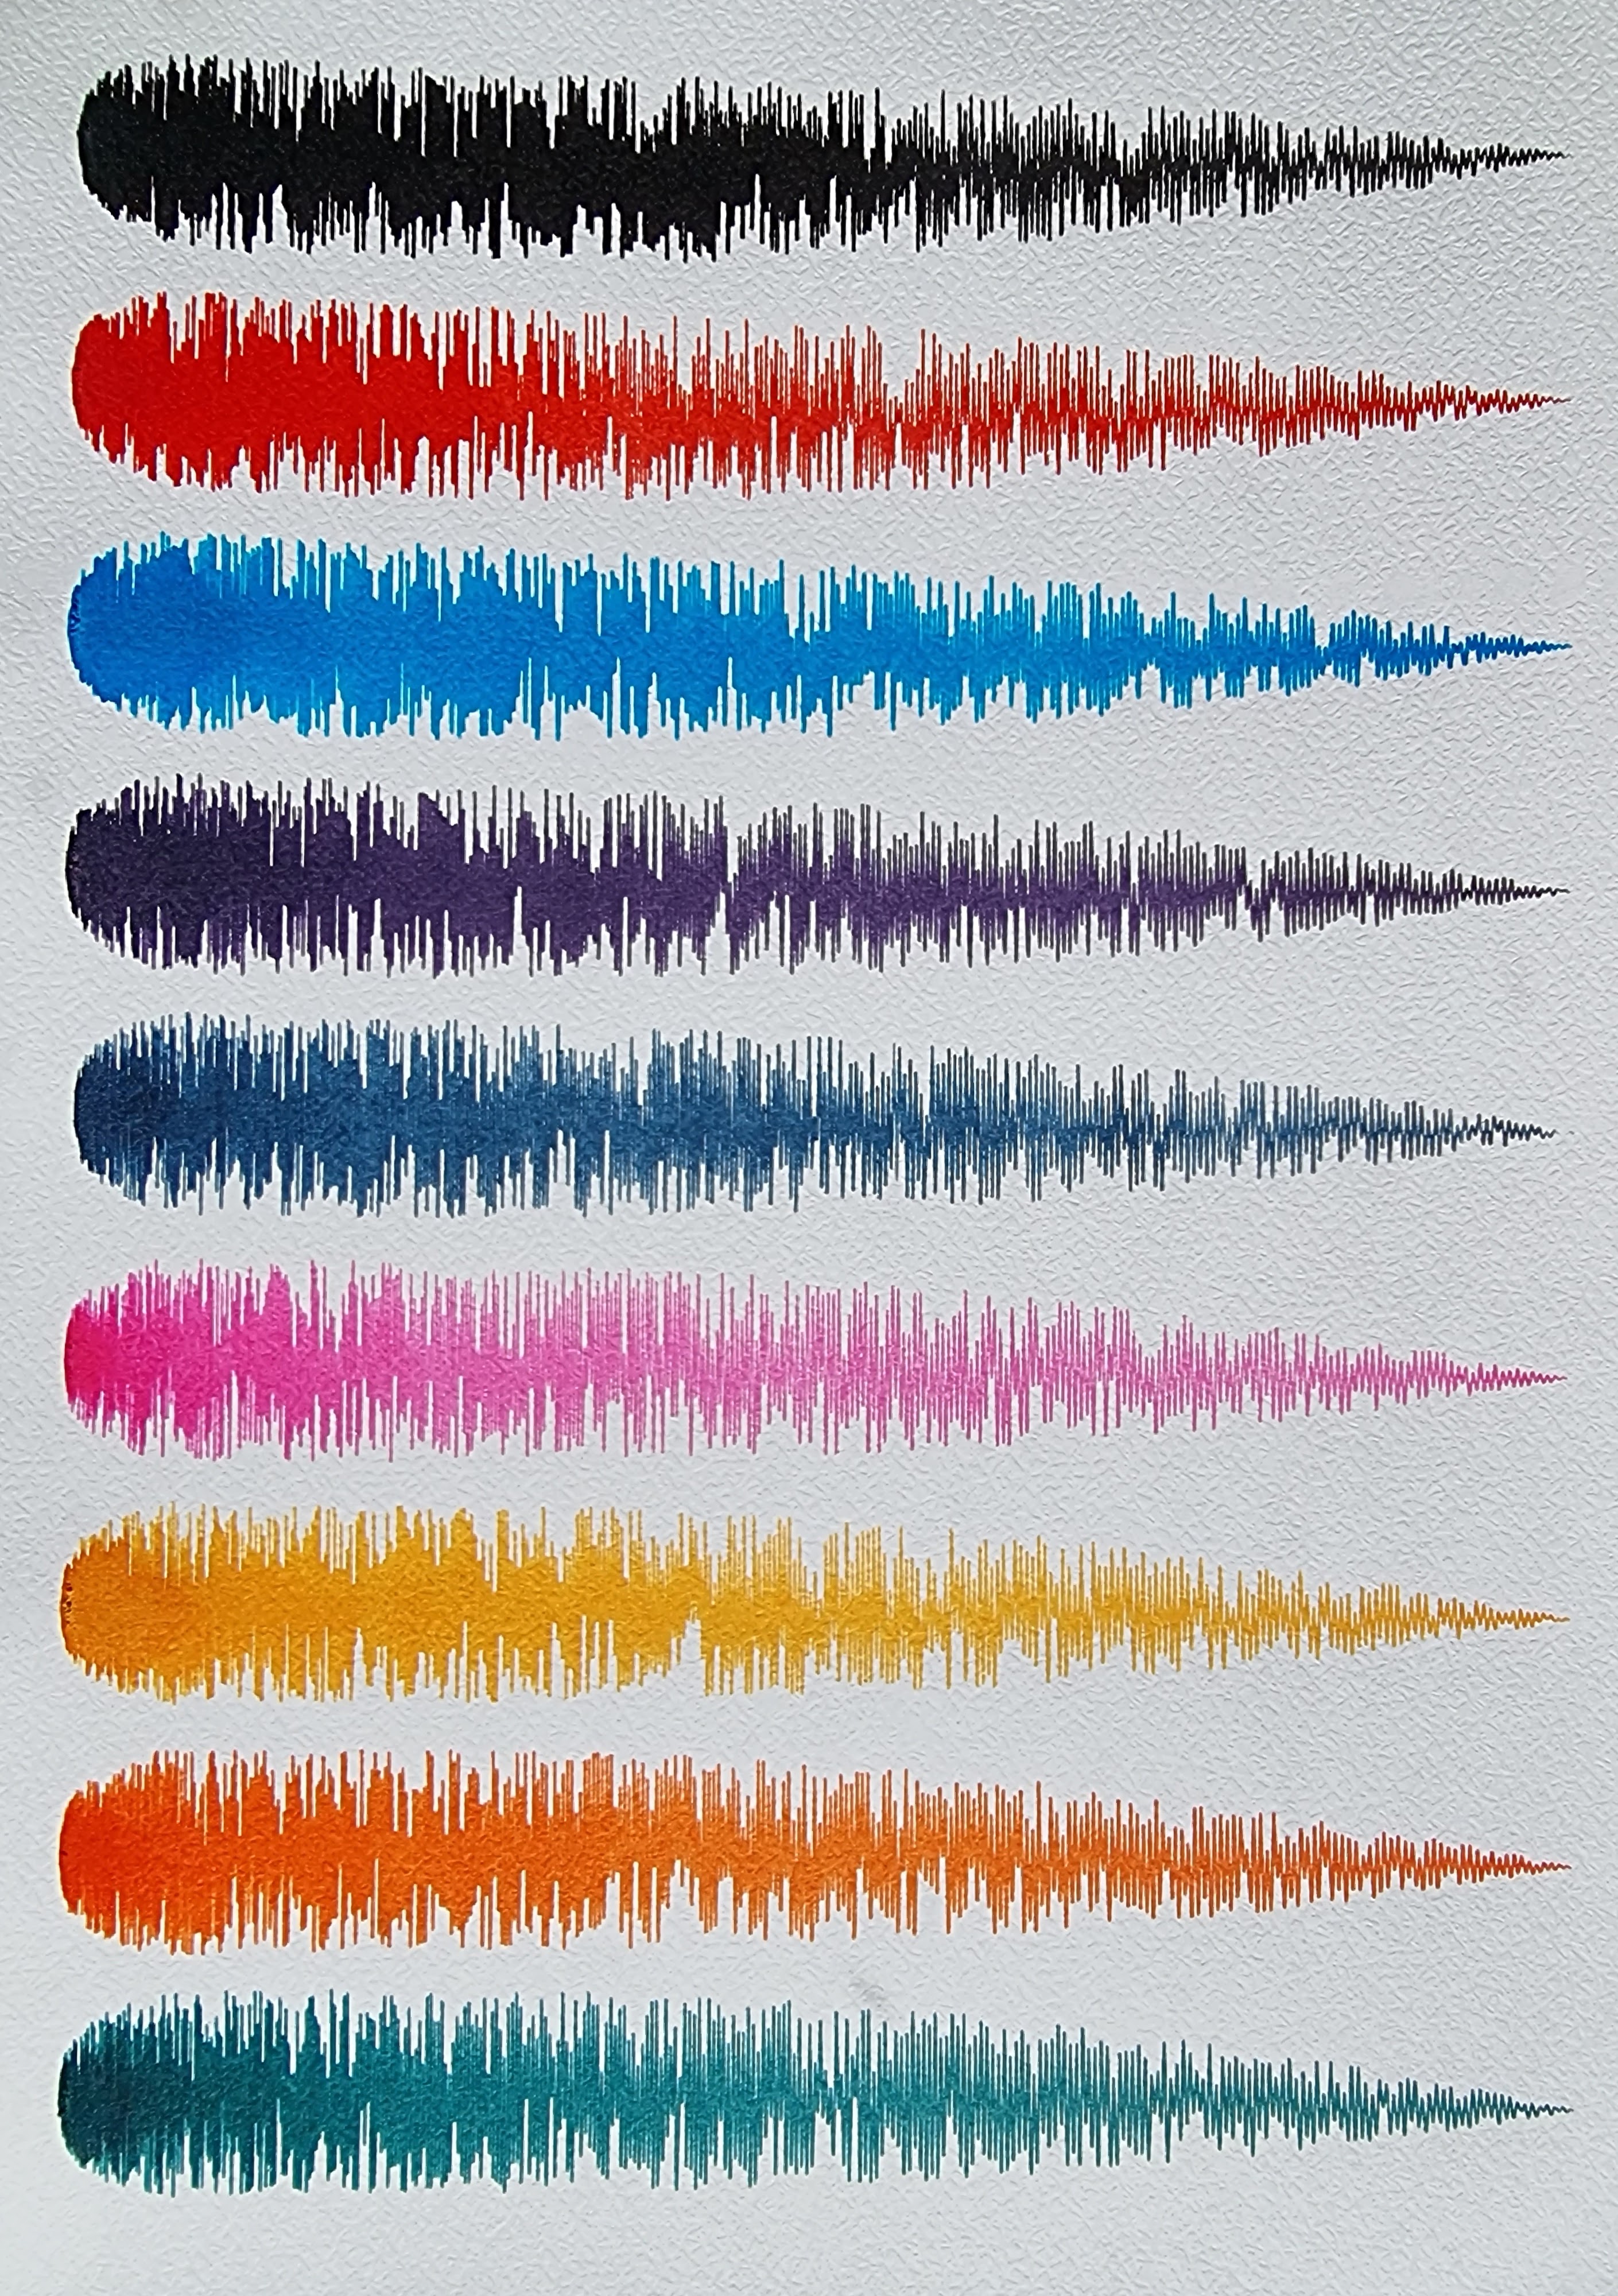
They are sorted from common to relatively rarer cases.
- Black
- Poppy Red
- Turquoise
- Amazing Amethyst
- Indigo
- Hope Pink
- Amber
- Pumpkin
- Aurora Borealis
The most common case is to obtain a plot that will only have one ink chosen, but the plot can go up to having 3 different colors. They are split into different layers.
Artistic challenges and choices
To wrap up, it took me quite a lot of iterations to reach decision on many aspects and tweak what would be my final pieces. In generative art and especially when you reach a high variety of results it is really hard to guarantee one given output is satisfying. This is especially true in my case that involve many level of recursion which makes it very hard to control the outcome. The wider your generation is, more likely you will get non interesting results or edge cases you do not prefer to happen. The boundaries of the generation have to be well controlled in order to avoid the "bad cases".
Total rewrite of my tech stack. Technically speaking, this generator was a total rework of my stack, which is in Rust, back into pure JavaScript. As the code is on-chain, it needs to be very well optimized in term of bytes and I used many techniques from back of my JS1K / JS13K days! I compressed my GLSL shader code as well as the JavaScript code, I use only tuples (arrays) to represent my data so they do not have the verbosity of JS objects, etc...
curating away the bad cases. The way I generally approached the curation in my generator is to curate away the cases I didn't want rather than explicitly curating the cases I want! Typically, one algorithm will control the quality of the output and will be retrying the result until it satisfies the criterias. One example is I have to exclude any "empty result" to happen. I also explicitely wanted to bail out a result containing only one cut (2 polygons).
Brace for impact. embracing collisions and allowing some shapes to intersect was part of the "glitch" I wanted to keep. It can be interesting to have a mix of inks that occur on these intersections. This is a rare effect.
recursion depth. It took me quite a lot of shattering iteration to decide on the maximum number of recursion I would do as well as it's rarity. At the end, I've chose to make the "low number of parts" rarer than having a very exploded shattered case, because it emphasis on what the piece is about. Pieces that are intacted or only cut in a few parts are still very interesting to have and should actually be quite scarced.
shapes rarity & filling consistency. The way the shape are filled are not always decided randomly and many logic bail out from cases I didn't want.